-------------------------[Start of Explanation of Thread Purpose ]------------------------
This thread is a continuation of the thread Spectrum of Musical Genres. It is a separate thread at the suggestion of the diyAudio moderator Pano, the original poster (OP) for the other thread. This thread draws from comments made in the other thread but with specific perspective of what those questions and comments mean to those that attempt to fix their own CD music tracks. With that in mind, I'll be quoting from that other thread here, the first of which defines the subject of the other thread:
The subtopic here has a slightly refined focus:
There are implications of the genre-specific power spectral density (PSD) averages that are perhaps not immediately obvious.
One observation of remastering music tracks is that as the complexity of the music and its instrumentation increases in size and weight, the resulting power spectra tend to converge on a IEC-268-like standard PSD, as discussed in the following paper: http://www.mountain-environment.com/AES_paper_1996_4277.pdf. If one is designing audio components, particularly loudspeakers and perhaps higher power audio amplifiers, to survive consumer use playing these genres of music then you'd have your answer and voila! , you're done. At least from the standpoint of designing to relative PSD levels divided to the various loudspeaker drivers via crossover networks...but not so much on the actual acoustic power output by frequency demanded from the loudspeakers by their owners.
If you were thinking about the implications of these genre-specific PSD curves outside of that narrow subject of "designing for loudspeaker/driver/crossover survivability", they also have implications for those that also do something about their poor-sounding CDs to help them to sound better. The source of the sound quality issues are largely traceable to creative equalization practices during mastering but also other mixing and mastering hiccups and more likely, odd ideas of what each record company A&E organizational belief system accepts as truisms in terms of selling records. That is of course another subject in itself largely out of scope for this discussion. See Philip Newell's Recording Studio Design or Floyd Toole's Sound Reproduction... for more in-depth discussions on that subject.
So the question is: "should the PSDs of our stereo CDs look like the average PSDs by genre in the article, or something else...because they presently don't sound very good as they came from the record company on my flat on-axis response hi-fi stereo setup in my acoustically treated room".
It turns out that the answer to that question is perhaps a little complicated (based on my experiences), but in general the answer that I've found (as a musician and engineer) is, surprisingly, pretty much a "no".
More to come.
Chris
-------------------------[End of Explanation]------------------------
This thread is a continuation of the thread Spectrum of Musical Genres. It is a separate thread at the suggestion of the diyAudio moderator Pano, the original poster (OP) for the other thread. This thread draws from comments made in the other thread but with specific perspective of what those questions and comments mean to those that attempt to fix their own CD music tracks. With that in mind, I'll be quoting from that other thread here, the first of which defines the subject of the other thread:
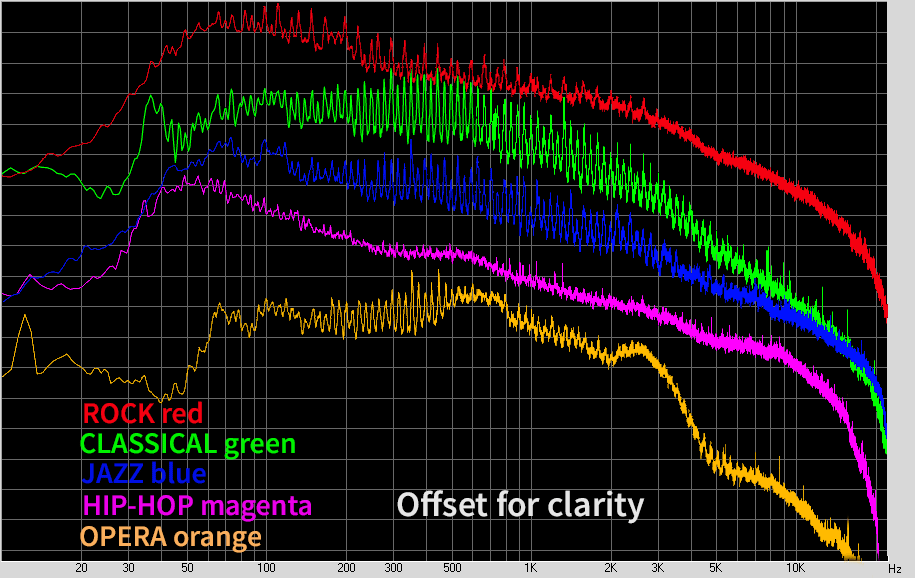
...It's the spectral content of music visualized. You can see the tonal balance of different types of music.
The graphs below are FFT analysis of different music genres. The files analyzed for the this test are the average of approximately 112 different recordings in each genre...[for the following genres:]
- Rock section is almost all Classic Rock. Zeppelin, Foghat, AC-DC, Janis Joplin, Eagles, Billy Idol, etc.
- Jazz tracks are mostly mid-century Bebop or Straight ahead. Dizzy, Miles, Coltrane, Mingus, Art Blakey, Horace Silver, Dave Brubeck, etc.
- Classical section is all orchestral, not chamber or choral music.
- Opera is a wide selection of mostly 19th century works.
- Hip-Hop is whatever I had. Eminem, Dr Dre, and others.

The subtopic here has a slightly refined focus:
...[to] add some perspectives from the standpoint of demastering music tracks to the discussion, thus reusing the data and perspectives...in a way that becomes even more useful, especially to those that have taken the time to dial-in their setups (flattening frequency response, extending and smoothing bass response, time-aligning the drivers within loudspeakers and within the entire loudspeaker array) and wish to get significantly more out of their recorded music tracks. These people might already be using parametric/graphical equalizers or "Cello" palette type of equalizers each time they play their favorite recordings to correct for mastering EQ and other issues in the as-is tracks.
There are implications of the genre-specific power spectral density (PSD) averages that are perhaps not immediately obvious.
One observation of remastering music tracks is that as the complexity of the music and its instrumentation increases in size and weight, the resulting power spectra tend to converge on a IEC-268-like standard PSD, as discussed in the following paper: http://www.mountain-environment.com/AES_paper_1996_4277.pdf. If one is designing audio components, particularly loudspeakers and perhaps higher power audio amplifiers, to survive consumer use playing these genres of music then you'd have your answer and voila!
, you're done. At least from the standpoint of designing to relative PSD levels divided to the various loudspeaker drivers via crossover networks...but not so much on the actual acoustic power output by frequency demanded from the loudspeakers by their owners. If you were thinking about the implications of these genre-specific PSD curves outside of that narrow subject of "designing for loudspeaker/driver/crossover survivability", they also have implications for those that also do something about their poor-sounding CDs to help them to sound better. The source of the sound quality issues are largely traceable to creative equalization practices during mastering but also other mixing and mastering hiccups and more likely, odd ideas of what each record company A&E organizational belief system accepts as truisms in terms of selling records. That is of course another subject in itself largely out of scope for this discussion. See Philip Newell's Recording Studio Design or Floyd Toole's Sound Reproduction... for more in-depth discussions on that subject.
So the question is: "should the PSDs of our stereo CDs look like the average PSDs by genre in the article, or something else...because they presently don't sound very good as they came from the record company on my flat on-axis response hi-fi stereo setup in my acoustically treated room".
It turns out that the answer to that question is perhaps a little complicated (based on my experiences), but in general the answer that I've found (as a musician and engineer) is, surprisingly, pretty much a "no".
More to come.
Chris
-------------------------[End of Explanation]------------------------
Last edited:
...I find it easy to make up a story of how the jazz appears to be related to the classical.
In general, hard bop jazz is like classical in that it is performed with all the players listening and reacting to each other in real time, i.e., multi-track layering of music tracks that is common to rock, pop, and their derivatives is rarely used in jazz and basically not used in classical recordings. Therefore the techniques of using mastering EQ on the finished down-mix stereo tracks is much more "mundane".
...The Hip-Hop looks very uniform, like pink noise. Rock is similar thru the midrange. My guess is that it's the wall of sound producing, with limited dynamics and no empty spaces that does it.
This is related to the nature of the instruments used in these two genres (rap and rock)...bass drum transients (acoustic or electronic bass drums), when converted into the frequency domain turn into all frequencies equally loud, but band-limited to frequncies mostly below midrange (the initial transient of the bass drum has higher frequency components that decay much more rapidly than lower frequencies, i.e.,
Chris
...My guess is that it's the wall of sound producing, with limited dynamics and no empty spaces that does it...
So, in other words, compression?
As mentioned above, most of the non-specular acoustic energy on the FFT plots usually comes from drums of various types (i.e., non-pitch-specific). Compression produces reduced amplitude peaks, while limiting (i.e., clipping) produces a succession of high amplitude odd-order harmonics, but only for the duration of the clipped/limited peak.
Chris
The other thing that is striking is how far down it is at 10 and 20 KHz. Always testing for flat response, I never considered the facts might be otherwise .
When looking at this last octave (10-20 kHz) it is usually indicative of the recording technology at the time of the original recording. Generally, in the 1960s-early 1970s, tape machines had a lot of hiss that could not be effectively attenuated, so the recording aesthetic seems to have been to roll off the highs progressively (i.e., using ramping filter), starting at either 3.5 kHz or perhaps more like 8 kHz as time marched on. I've found that the engineers that got used to using this sort of attenuating EQ tended to continue to use it even after the advent of Dolby processing to suppress tape hiss. This seems to have continued on into the mid-1980s (after the introduction of the CD 1982 and digital recorders slightly earlier).
After the mid-1980s, recording aesthetics began to change, more-or-less "flipping the coin" to overemphasized highs on certain genres, notably hip-hop, and some harder rock genres.
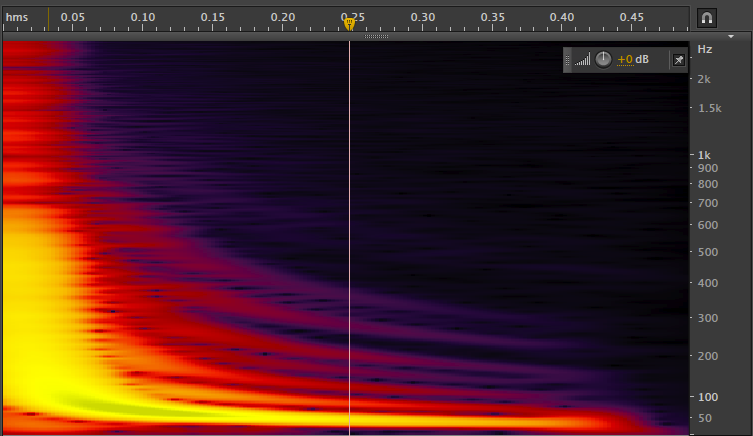
I've found that it takes a good hard look at the spectrograms (an example of one is below) to see where the noise floor is in order to rebalance the highs above 10 kHz.
Chris
 I"ll get the hang of it...
We should test for flat response, we don't want a curve like this! But this should give you an idea of how much energy there is in different parts of the spectrum.
I agree with this. Most people think that the amplitude is flat vs. frequency if you ask them to guess, not realizing that the human hearing system has evolved to adapt to sound spectra of common noises.
I've found empirically that it's -17 dB/decade (-5.2 dB/octave) for music and speech. I have no current theories why that seems to be the number. BTW: it's easy to set the spectrogram colors to that -17 dB/decade within audio editing tools, such as Audacity (the tool that I use).
And there is the roll off at the top, which in classical and opera is more striking.
Again this is a function of the venue and microphone separation from the musicians/sound sources, in which the absorption of air and the spreading of higher frequencies (with much higher attenuations on their boundary reflections) becomes significant. Most symphonies perform in large auditoria with definite issues toward higher frequency absorption, while chamber music usually is performed in much smaller rooms, and you see that above 7-8 kHz in the resulting recordings of string instruments (violins, viola, cellos, etc.).
Opera is even more exaggerated in that the orchestra music accompaniments must be thinned out to avoid covering up the voices. Hence you see the drop off of the spectra of opera average spectra outside of 200-1200 Hz for the recitatives and even some of the arias (full choruses):

Chris
By the way, when restoring orchestral tracks that have been altered from the "as recorded" EQ, it is again critical to look closely at the spectrograms above 4-8 kHz for the background noise levels to make sure that the inverse EQ applied to "undo" the mastering EQ is not overdone, and results in too much higher frequency string harmonics. It actually takes a little practice to do that well. The flip side of this is that, once you find an inverse mastering EQ curve for an album, typically classical albums use the exact mastering EQ curve for all tracks on the album.
This is something that isn't true for rock, pop, etc. and almost all other genres, in which every track is individually EQed with its own unique mastering EQ curve (and sometimes more than one curve per track if the music tracks are very long) to maximize the "potential sales volume" for the album overall--and for each track in particular.
This is something that isn't true for rock, pop, etc. and almost all other genres, in which every track is individually EQed with its own unique mastering EQ curve (and sometimes more than one curve per track if the music tracks are very long) to maximize the "potential sales volume" for the album overall--and for each track in particular.
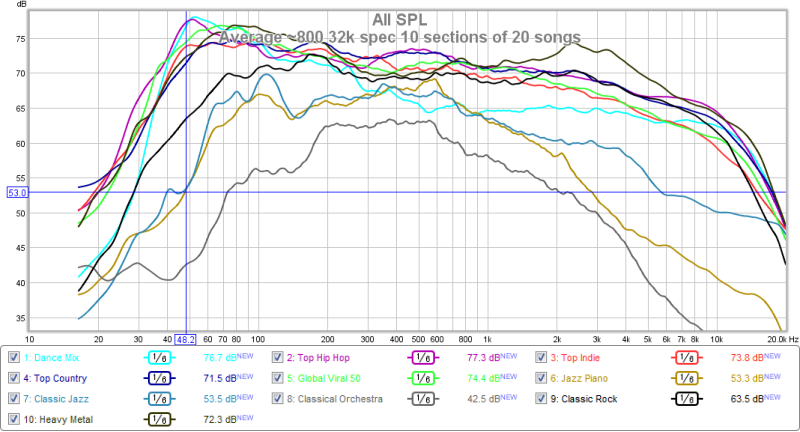
I did a similar study three years ago and posted the results on TechTalk.
Here is a summary graph. It is pretty similar to yours except I didn't normalize so that I could see something about the dynamic headroom allowed compared to the average. I also used 1/6 octave averaging, so I don't get the -3 dB/oct rolloff that you get with a straight FFT. Pink noise comes out flat. The spectral averaging also hides the 1/12 octave peaks from the chromatic scale that you see.
The details are here:
Musical genre specific average spectral content - Techtalk Speaker Building, Audio, Video Discussion Forum
Marc
One of the things that I noted about the smoothed cumulative PSD curves posted in the original thread is that they disguise many of the features that I use to restore music track EQ to "as recorded", or "as it would have sounded if performed all together--live without artificial boosts of electrical instruments above acoustic instrumentation".
My PSD plots use the highest resolution available in order to see the individual frequencies and the trends in mastering (or even stem-mixing) EQ. For instance, the following "plot spectrum" view from Audacity of a typical 1960s classic rock track (the cumulative average of the first 3:45 minutes of the track, that is).

One can see the rise in SPL at 4 kHz and the overemphasis of the 80-900 band relative to the other frequencies.
I've included an example first-cut demastering (inverse) EQ curve below for this particular track in order to show the effect of having higher resolution FFT plots in order to see what has actually been applied to the tracks (or picked up along the way from poor microphone placement and perhaps creative mixing practices):

You can see the low frequency attenuation common to all commercially produced stereo tracks, and the tilt of the spectrum toward high frequencies, resulting in a very "thin" sounding track on the record, if reproduced on flat frequency response studio monitors or a good dialed-in home hi-fi rig.
Chris
Last edited:
...Can average dynamic range of all music genres be calculated from graphs ?
Generally, you can't see crest factor from these FFT plots. I use the dynamic range meter plugin in foobar2000 to see the dynamic range of the tracks, both before and after editing them. Generally speaking, the dynamic range increases by at least one point on the TT Dynamic Range Meter scale once the bass below 100 Hz is restored.
...The main idea behind my tests was to find the shape of the music curve. For rock and Jazz it looks pretty similar. Bass rolls off under 60 Hz at 24dB/octave. The top end rolls off above about 80Hz at 4.5 dB/octave.
Pink noise with its 3dB/octave roll off is typically used for loudspeaker testing, for technical reasons. Brownian noise, which rolls off at 6dB/octave is often said to be more like the music spectrum than pink noise. I've always found it to be in between the two, as my average plots show.
Over in the Beyond the Ariel thread there was some testing of compression in bass drivers using pink noise. But that got me to thinking that sine sweeps and pink noise always sound far too bass heavy during tests. They don't sound like the tonal balance of music. Of course sine wave sweeps also contain far more top end energy than pink noise or music, I've popped a few tweeters that way.
Maybe it would be better to do some of our testing with a signal that more closely mimics the musical spectrum than current test signals. It should not be our only test signal, but it could be handy. I've been able to filter white noise and sine sweeps to very closely follow the Rock/Jazz spectrum - and hope to try using them in tests. I can post those signals here, if there is interest. It's funny to listen to the filtered sine sweep, it's far from linear, but does not sound as odd as I thought it would.
As I mentioned above, a -17 dB/decade (-5.1 to -5.2 dB/octave) tilt is empirically what I've used for music over the past 14000 tracks. This is in between some numbers quoted in the original thread.
Chris
...the spiky graph for classical and opera is an unexpected result. I don't know if it has to do with tuning, dynamics, or something else.
And to answer Hearinspace's question, I don't know why there is such a difference between my classical plot and Marc's. Is it the recordings chosen, the method of averaging? I just don't know. Maybe I need to try a different 100 tracks to see how repeatable the results are.
This "spiky graph" is a qualitative measure of dynamic range. Here is a plot from the same Chapman JAES article on the average dynamic range (crest factors) of the different genres that he measured:
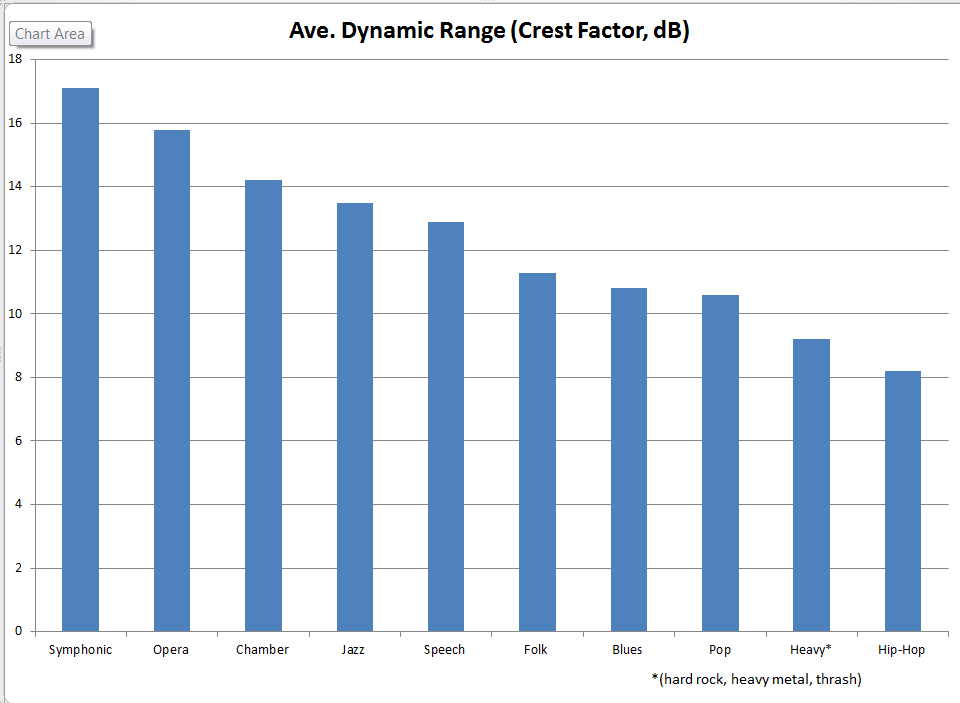
Good chart. I remember seeing the numbers and thinking that they are lower in dynamic range than what I normally measure. Symphonic can be 22-25dB and some good rock/pop will be in the 20-18dB range. 18dB used to be a CD mastering standard.
Suppose it depends on how you average the signal.
Suppose it depends on how you average the signal.
Yeah, I hadn't thought about that. Was thinking mostly the content of the instruments themselves. I do have an anechoic orchestra recording I could check. It's possibly brighter.Again this is a function of the venue and microphone separation from the musicians/sound sources, in which the absorption of air and the spreading of higher frequencies (with much higher attenuations on their boundary reflections) becomes significant.
Yes, the calculation of crest factor seems to produce significantly different results based on the details of how it's implemented, as evidenced by the discussions on the DR Database site over the development of the initial foobar2000 plugin to replace the standalone TT Dynamic Range Meter: [not my release] foo_dynamic_range
Here's a description of how the TT Dynamic Range Meter algorithm is actually implemented: http://www.dynamicrange.de/sites/default/files/Measuring%20DR%20ENv3.pdf
I think that the above bar chart on relative dynamic range is an indicator of the degree of dynamic range differences between genres, at least as it stood in 1996 with the CDs selected when Chapman did his paper.
Chris
Last edited:
Very few classical orchestras use A440 except the british and lesser american ones. Everybody else uses A442-445.
Baroque music has it as A415.
There is a very interesting Wikipedia page on this subject (also quoted in the original thread) that really blew me away years ago when I first read how different it was during the time of Mozart, Haydn, and Beethoven. (Mozart notably had a long-term memory of pitches spanning months or years.):
An A415 concert pitch is easily enough difference that people with true absolute pitch would be throwing fits...because the pitches would be so far off what their internal pitch identification would be. (If you know anyone with absolute pitch, they consider anyone playing off-pitch to be actually playing the wrong notes--it's that strong of a perceptional correlation for them. )From the early 18th century, pitch could be also controlled with the use of tuning forks (invented in 1711), although again there was variation. For example, a tuning fork associated with Handel, dating from 1740, is pitched at A =422.5 Hz, while a later one from 1780 is pitched at A =
Overall, there was a tendency towards the end of the 18th century for the frequency of the A above middle C to be in the range of
Now we're getting somewhere. I've always calibrated my demastering to the "realism" of live performance, and I've found that the -17dB/decade PSD response goes for any genre of music that is "full" in terms of its harmonic content.Back in the early '80s, when portable, battery operated RTA became available, I took one to a live symphony performance. San Francisco. 5th row, center. I recall being surprised about how "flat" the results were. Yes, the top octave or two were down, but the rest was close to flat. Yes, it was a very limited device, 1 octave bands.
However, if you're analyzing something like a soloist and piano accompaniment, or something like "drum and bass" or their like genres, these instrumentations are too sparse and the resulting PSDs will not look like a -17dB/decade curve. Solo piano recordings sometimes have an "arched back" PSD, and sometimes string quartets and chamber orchestras will diverge from the 1/f curve (especially below 100 Hz). But in general, if you've got any form of popular music (rock, pop, country, the various electronic genres, etc.) if their resulting recordings look non-flat to the 1/f curve, then you've usually got creative EQing during mastering, and sometimes in the mixing process, too.
Chris
...I've found empirically that it's -17 dB/decade (-5.2 dB/octave) for music and speech....
Speculation:
There would be natural roll-offs of 6dB/oct or more, treble and bass, due to mass killing the highs and insufficient area killing the lows.
This would be "natural", for instruments, and to the ear.
For musical purposes instrument makers and musicians ring-out the higher musical pitches (and scale the percussion tizzzz similarly) for more clarity. They shift 6dB/oct toward 5dB/oct.
That's "on average". Any small sample will show wide deviation as "spectral signature". You could in principle mask the beat and the pitches, and you would still know Chamber from Orchestra from Rock by the different spectra.
The -17 db/decade that I cite is pretty obvious when you get everything dialed in in your setup, and then listen to music tracks that have been EQed to -16 dB/decade and -18 db/decade (...we're talking 0.3 dB/octave differences here...). The ears just seem to know and really lock in naturally to that -17 dB level--in my experience. To hear this clearly, I find that you have to flatten your setup's direct-arrival frequency response to ±2-3 dB from about 40 Hz to at least 10-12 kHz, and control the main nearfield reflections in a manner like Toole describes in his book. Then it becomes quite obvious to everyone, I find.
Having said that, there is some variation between music genres and even track-to-track comparisons for the same musical artists, but those differences I find are really measured in 1-3 dB variations from the -17 dB/decade curve (i.e., NOT 10-20 dB deviations that you will likely see there). If you see bigger differences in your music tracks (mostly the case), then you probably have an overdone mastered track in terms of applied EQ after mix down to stereo. The other possibility is that you have music tracks without full enough instrumentation to establish the 1/f curve statistic, even sampled at the loudest portions of the track.
That brings up another issue. There is one other factor here that I've not discussed and that is the phenomenon known as "accommodation". This is a problem when discussing this subject, i.e., removing mastering EQ from music tracks that was originally put on them to make music sound not so bad on very poor performing consumer loudspeakers and ear buds. Many people have imprinted on those overheated highs and rolled-off lows, unfortunately. I have no solutions for that issue other than to encourage broadening of musical tastes and generally encourage recalibrating one's ears to fully acoustic live performance as often as possible (i.e., no electrical, electronic, or amplified instruments). I find that only after that recalibration can one have productive conversations on using your ears to determine reasonable demastering levels. YMMV.
This remains a major obstacle, and one that usually defaults to the ears of the "professionals" being paid to do it, unfortunately. It's unfortunate because these same professionals aren't using really hi-fi quality loudspeakers and well setup-up room acoustics to balance the recordings that mimic good hi-fi setups. Rather they're most often using what is called "studio monitors" that mimic large classes of poorly performing consumer loudspeakers. This is the "Auratone 5c Sound Cube and Yamaha NS-10M nearfield monitor" problem used in mastering popular genres of music. (See Philip Newell's Recording Studio Design for an in-depth discussion of this problem).
Chris
However, as I've posted over the years, a typical early CD mastering level was for the RMS value of the music to be 18 dB below peak. That makes for a fairly dynamic recording. Most classical is even more dynamic with 22 to 26dB of headroom. Another typical level is 16dB below peak which is used on a lot of recent jazz and vocal recordings. I've seen Metallica recordings with an average of 10dB below peak, and I suppose that new recordings are even worse...But that's another topic, and has been covered in abundance in other threads.
Actually, there is an online database that you can access almost all recordings of general interest: Album list - Dynamic Range Database
In my digital library of CD stereo recordings (most of which I have demastered), the most dynamic album that I own is Crash by Charly Antolini (the drummer), which by most measures is almost unlistenable unless my wife, dogs, and cat leave the area-and then it is merely disruptive to listen to. Playing this album at anywhere near concert level results in blowing some dust out of the fans in the subwoofer amplifiers. You really can't play that CD softly and hear anything worthwhile.
But I do see a lot of -17 to -19 dBFS CDs of better quality (i.e., are largely classical and other less popular music).
I've seen -4 dB average levels in many popular CDs, and most of the better quality CDs recorded and released in the last 10 years have an average -6 or -7 dBFS level (which I immediately use "clip fix" on to restore peaks and thus remove the almost continuous odd harmonics that are produced. This usually brings the average playing levels back down to something closer to -18 dBFS, which is about 0 dB "ReplayGain" level used in foobar2000, and the dynamic range back to something like 10--12 dB crest factor as calculated by the dynamic range meter in foobar2000. It really settles down the CDs to make them sound more listenable by removing the clipped peaks.
I've run into this before. If you are sitting somewhere back in an auditorium on or off centerline, you may get pretty severe seat dip issues or "audience absorption" issues. But a Decca tree on stage should avoid all that. What you're hearing in most symphonic recordings is a pretty significant bass attenuating EQ filter that starts at 450 Hz and goes to almost -12 dB at 20 Hz (on average)....The spectra for "classical" ensembles are correct. Even hiring eight double-bass players won't fill-up the bottom under a mass of fiddles, and few classical instruments have strength above a couple KHz.
However, if you are sitting on stage in the orchestra (as I've calibrated to from my music school days), then the double basses will almost overpower you at times--almost rattling your teeth in your mouth.
I prefer a 1/f rising response on symphonic music below 450 Hz (the turnover frequency that is most often used for class music mastering EQ), down to 50-60 Hz. The open "E" string on the double basses is ~41 Hz (on a A440 tuning system). Only the bass drum, the contra clarinets and bassoon, and the double B flat tuba has acoustic energy below 40 Hz.
One other point: if you're talking string orchestras, then the highs will be rolled off above ~4 kHz. This is not true when the winds are playing, and again, a Decca tree will pick this up quite clearly even if they are the only microphones being used on stage.
Chris
Last edited:
I've not had a chance to compare but I venture that the 'average' LF eq for classical matches LP equalisation. Much as I love vinyl I accept that under 100Hz is horribly compromised compared to CD which will go down almost to DC.
If the recording was done after the advent of SACDs in the early 2000s in multichannel (5.1) format, then you typically see extended low end on the SACD (in my experience) and rolled off low end on the stereo CD. This is due to the differences in assumptions by the record company/mastering folks: they assume if the buyer is buying a multichannel SACD, then that usually means that the buyer is also using a 5.1 (or more) setup if playing the multichannel DSD tracks, and bass-limited stereo loudspeakers only if playing the stereo track (i.e., no bass drum and string bass/electric bass LFE on the subwoofer channel).Possibly, but wouldn't they have remastered for CD?
If, however, the recordings were done before SACDs were in existence (~2000), then the low end of the SACD will typically not differ from the CD's. In other words, the SACD of those older recordings are typically nothing but transfers from the master of the CDs--and the multi-track libraries of the original recordings are typically lost or otherwise not used.
Some of the most spectacular recordings that I own are multichannel SACDs of the group The Yellowjackets. Jimmy Haslip's 5-string jazz bass is not attenuated on these discs, and really add to the palpability of the performance in a way that reminds me Bach's preludes & fugues in live performance.
Chris
- Status
- This old topic is closed. If you want to reopen this topic, contact a moderator using the "Report Post" button.
- Home
- General Interest
- Everything Else
- Spectrum of Musical Genres--from the Perspective of Remastering or Demastering Music