I's not me who "doesn't care what is between them", rather it's a logical and inevitable consequence of coherent waveform reconstruction, that is synchronized by the fundamental.
Hi Edmond,
just teasing you a bit
 . It is good that you have an option of a standard spectrum analysis.
For low-end ADCs like in a computer motherboard I think it is quite valuable. The distortion of my last few motherboards has been so predictable that I could subtract one channel from the other and the harmonics subtract very well, up to 20db or maybe more. This is useful when testing buffers where the gain is 1.
I think lowering the distortion of most modern motherboard soundcards to under -110db should be possible. This isn't very good compared to pro stuff but I would have jumped at it if I had known about it since I don't have access to really good gear.
I think lowering the distortion of most modern motherboard soundcards to under -110db should be possible. This isn't very good compared to pro stuff but I would have jumped at it if I had known about it since I don't have access to really good gear.
For low-end ADCs like in a computer motherboard I think it is quite valuable. The distortion of my last few motherboards has been so predictable that I could subtract one channel from the other and the harmonics subtract very well, up to 20db or maybe more. This is useful when testing buffers where the gain is 1.
I think lowering the distortion of most modern motherboard soundcards to under -110db should be possible. This isn't very good compared to pro stuff but I would have jumped at it if I had known about it since I don't have access to really good gear.
Hi Keane,
Apparently low cost sound cards (having higher distortion levels) benefit more from this compensation technique. But regarding high-end sound cards, far less is gained by this technique, probably because the distortion is already significant lower.
This morning (when it was a little colder) I repeated a THD measurement according "method 1" as outlined in post 679, but using the reference data from yesterday. THD without compensation: -120.5dB, THD with compensation: 125.3dB. That means an improvement of only 4.8dB, hardly worth the effort.
Cheers,
E.
That's very true, actually we are hitting the same issue in https://www.diyaudio.com/forums/equ...ensation-measurement-setup-2.html#post5584029 , detection of base frequency phase to generate precise reference sine. Please is any more information on your procedure available? Our preliminary code is available at GitHub - pavhofman/nonlinear-compensation: Compensation of nonlinear sound card distortions for audio measurements , also using octave. I have some ideas about the detection in time domain, consulting/discussing could be a mutual advantage.
Hi phofman,
Normally I would share my ideas and methods with the audio community (for example TMC), but in this case the calculation of the exact phase of the fundamental is key to the performance of DiAna and makes it an unique product. So I'm reluctant to reveal all the details (the more so as some of the competitors try to worm out my secret).
But tell me how much precision you really need. Maybe you don't need the ultimate level of precision at all and I might help you by disclosing some less "secret" parts of the algorithms involved.
Cheers,
E.
Referring to post #675. If the samples in the upper plot are spaced dt apart in time, and the ADC sample-rate is fs=1/dt. In the bottom plot the interleaved samples are spaced dt/5 apart in time, making the interleaved sample-rate be 5*fs.
I think that the confusion that many of us have is not understanding which sample-rate is being discussed in the description of DiAna.
I think that the confusion that many of us have is not understanding which sample-rate is being discussed in the description of DiAna.
Someone ask what's better a regular/traditional FFT spectrum or a DiAna THD spectrum.
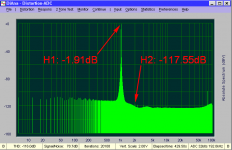
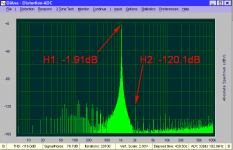
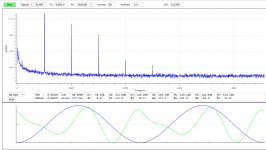
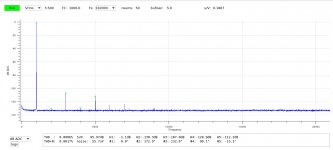
To answer that question, please have look at the pics below. The first one is a non-coherent average of regular FFT, while the second one is obtained by coherent averaging. No further data massage has been applied, i.e. no leakage compensation and no side lobe reduction, only a Hann window is used (named after Julius von Hann. So from now on be warned: any illiterate who still calls it a Hanning window, will immediately be put on my ignore list ).
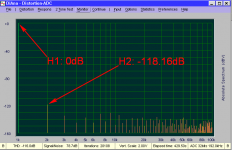
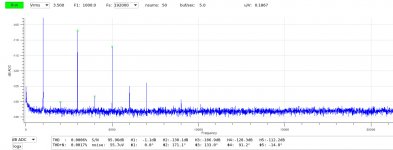
The third pic shows a typical DiAna spectrum.
The regular spectra reveal not only a massive leakage from the fundamental, but also the magnitude of the fundamental and its harmonics are a few dB too low, all due to the (necessary!) window. Using no window at all is no option, as one will get rubbish. Only the 2nd and 3rd harmonic is hardly visible in the 1st pic (because of noise). Due to coherent averaging however, clearly visible in the 2nd pic. The 3rd spectrum is not plagued by these shortcomings: The magnitudes of the harmonic are correct (easily verified by means of simulation), no leakage or side lobes. Simply because the FFT is taken over exactly 1 period of the fundamental (or more precisely, the reconstruction of the fundamental and it harmonics). Therefore no window (Hann, Hamming, Kaiser or whatsoever) is needed.
BTW, DiAna does have provisions to enhanced the regular spectra, which are normally enabled. In these examples however, I've disabled this data massage (by setting some options in the ini file) to clearly show the differences in performance.
Cheers,
E.
To answer that question, please have look at the pics below. The first one is a non-coherent average of regular FFT, while the second one is obtained by coherent averaging. No further data massage has been applied, i.e. no leakage compensation and no side lobe reduction, only a Hann window is used (named after Julius von Hann. So from now on be warned: any illiterate who still calls it a Hanning window, will immediately be put on my ignore list
). The third pic shows a typical DiAna spectrum.
The regular spectra reveal not only a massive leakage from the fundamental, but also the magnitude of the fundamental and its harmonics are a few dB too low, all due to the (necessary!) window. Using no window at all is no option, as one will get rubbish. Only the 2nd and 3rd harmonic is hardly visible in the 1st pic (because of noise). Due to coherent averaging however, clearly visible in the 2nd pic. The 3rd spectrum is not plagued by these shortcomings: The magnitudes of the harmonic are correct (easily verified by means of simulation), no leakage or side lobes. Simply because the FFT is taken over exactly 1 period of the fundamental (or more precisely, the reconstruction of the fundamental and it harmonics). Therefore no window (Hann, Hamming, Kaiser or whatsoever) is needed.
BTW, DiAna does have provisions to enhanced the regular spectra, which are normally enabled. In these examples however, I've disabled this data massage (by setting some options in the ini file) to clearly show the differences in performance.
Cheers,
E.
Attachments
Someone ask what's better a regular/traditional FFT spectrum or a DiAna THD spectrum.
To answer that question, please have look at the pics below. The first one is a non-coherent average of regular FFT, while the second one is obtained by coherent averaging.
I peek in on this occasionally to remind myself of why I don't volunteer to maintain DIY software.
I think a possible confusion stems from there being two synchronous averaging methods possible, Neither can create information that is not there. The Shibasoku technique gives only information at harmonics of the fundamental, the noise is still there it simply appears only at the harmonics. The unwindowed FFT technique can also work, for instance, an oscillator such as Viktor's can be injection locked to the A/D clock and all the spectral leakage will disappear. I think this is what ihquam is talking about. It's worth noting that a 1K sine wave sampled at 96k has only 48 unique codes (only 24 in sign/magnitude).
Last edited:
Fine tuning the ADC clock is not always possible and if possible you need additional hardware to phase lock it to the test signal. Doing it the other way around (that's actually what DiAna does by reshuffling/resampling the data and phase lock it to the ADC clock) is a more universal and cheaper solution.
Cheers,
E.
Cheers,
E.
Fine tuning the ADC clock is not always possible and if possible you need additional hardware to phase lock it to the test signal.
E.
Not what I said, you lock the test oscillator to the A/D. I've done it, it works. You take one channel and generate a 1KHz tone to lock the oscillator to and measure with the other. I also mean exactly 1kHz using 96K FFT's, I won't use any software that does not support arbitrary N FFT's (the stone age).
Big smiles BTW what you are doing is a lot of good work.Someone ask what's better a regular/traditional FFT spectrum or a DiAna THD spectrum.
...
Using no window at all is no option, as one will get rubbish.
...
Cheers,
E.
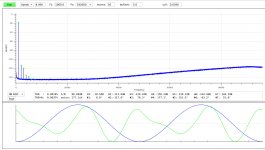
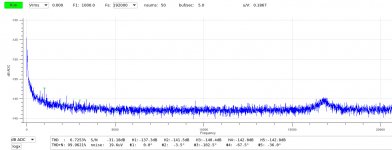
Using no window function. Does this look like rubbish?
Attachments
Last edited:
Normally I would share my ideas and methods with the audio community (for example TMC), but in this case the calculation of the exact phase of the fundamental is key to the performance of DiAna and makes it an unique product. So I'm reluctant to reveal all the details (the more so as some of the competitors try to worm out my secret).
But tell me how much precision you really need. Maybe you don't need the ultimate level of precision at all and I might help you by disclosing some less "secret" parts of the algorithms involved.
Hi Edmond, fair enough, it is your know-how which makes your living.
For now I will keep the phase detection/calculation simple, there are other more important issues to solve. Still I appreciate your offer, thank you.
Using no window function. Does this look like rubbish?
There is more than one way to do this no need for negative comments. Samuel Groner has achieved remarkable results with passive notch filters.
Last edited:
Using no window function. Does this look like rubbish?
What is the noise floor of the DAC/ADC?
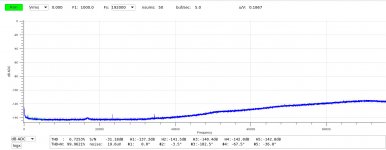
My previous spectral plots in post #692 were measurements of my ZD25 amplifier, which is similar to the PassLabs XA25, with the following signal path.
DAC => OPA1632 => ZD25 => 8Rload => resistor attenuator => ADC
My PCI soundcard is an M-Audio Audiophile-192.
The images below show loopback spectra as follows:
DAC => OPA1632 => ZD25 => 8Rload => resistor attenuator => ADC
My PCI soundcard is an M-Audio Audiophile-192.
The images below show loopback spectra as follows:
- 3.5Vrms out, 1kHz (-1db full scale)
- same as 1 but zoomed
- 0Vrms out, 1kHz
- same as 3 but zoomed
Attachments
Last edited:
Hi Scott,Not what I said, you lock the test oscillator to the A/D.
My apologies for misreading your post (I though you were still referring to the Shibasoku technique)
So this technique greatly increase the number of "allowable" frequencies for a windowless transform, though still not any frequencies is allowed. Am I right?I've done it, it works. You take one channel and generate a 1KHz tone to lock the oscillator to and measure with the other. I also mean exactly 1kHz using 96K FFT's, I won't use any software that does not support arbitrary N FFT's (the stone age).
Thank you. (BTW, if you don't mind, this old geezer stick with the paleolithic 2^n FFTBig smiles BTW what you are doing is a lot of good work.
)Cheers,
E.
So this technique greatly increase the number of "allowable" frequencies for a windowless transform, though still not any frequencies is allowed. Am I right?
Yes, and it works fine with 2**N FFT's with a little math bookkeeping. I was initially puzzled over the any allowed frequency but as I thought there is at times some slight interpolation needed as I saw in your post #115 explanation.
Splines
In case of sparsely filled bins, this "slight" interpolation wasn't easy at all. Eventually, I got satisfactory results using periodic cubic splines.[...] at times some slight interpolation needed as I saw in your post #115 explanation.
Wow! Hats off for cubic splines.
When I fooled around writing software that mapped word processor font files into orthogonal semiconductor layout polygons, I discovered that PostScript fonts (Adobe, Mac) used cubic splines but TrueType fonts (MS Win) used quadratic splines. It was so . much . easier . to debug the quadratic splines routines that I quickly gave up on doing the cubic too. Congratulations on your success, I appreciate how painstaking it must have been.
Uh, the availability of 30X more TTF fonts than PostScript fonts, at zero cost (pirated copies floating around the Usenet newsgroups), may have influenced the decision as well.
Last edited:
- Home
- Design & Build
- Equipment & Tools
- DiAna, a software Distortion Analyzer