At the first, you must forget the Spectrum FFT of your oscilloscope. The 8bit is very limit for that.
The Radford is the DMS4? I don't know if this is capable to achieve 0.00001@ THD (-140dB) measurement at the range of 10KHz-100KHz. I see at technical papers of DMS4, a noise level a little better from 96dB, at the 10-100KHz range for the input voltage range of 1-10V
The 10KHz signal wants 6-8 measurements above the fundamental frequency (i.e 20-30-40-50-60-80KHz) to measure the THD with accuracy.
Please, repeat the measurement with the Radford only and a range of 10-100KHz.
Another happy DIY-er
Hi Frex,
Thank you for your great work!
I've got your kit few weeks ago and, as promised, here is final result (in attachment).
A few notes re this project:
- capacitors C35 to C39 and C41 are 1206 case, not 0805 as in Part description (at least, for PCBs I have got);
- values of resistors R59 to R61 and R3, R5, R53 are swapped in BOM compared to schematics. It's OK for 10kHz version (as they are in parallel) but for 11kHz I ended up with 27k instead of 820 Ohm and 1.5kHz oscillating frequency
- I have noted that 10k and 11k oscillators easily go to saturation during start-up if output level set above 5Vp-p, so it is advised to reduce output level before turning oscillators ON;
- As for H2 adjustment the best way is to connect millivoltmeter to H2 output and set the DC voltage as close to zero as possible (usually within +/- 100uV).
Hope that would help to other DIY-ers to get this project done.
Attachments
Hi Frex,
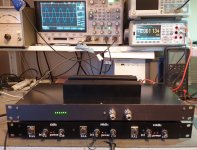
Yes, the top 1U case is linear PSU I have built for my projects.
It has 6 outputs (and 4 separate grounds):
+/- 18V GND1&2, +5.5V and +3.6V GND3, +5.5V and +3.6V GND4.
All outputs routed to four 12-pin connectors, two on the front panel and two on the back.
Based on LT3081, LT3091, LM350 and LT3083 chips.
BTW, for your oscillators instead of obsolete and now hard to find BC560C I have used 2N3906TF transistor.
Cheers,
Eugene.
Hello Frex, thanks for the great work regarding the AN67. I am interested in buying 3 PCBs of the EOSC10KV4.02. I wanted to PM you but diyAudio won't let me because I am under moderation until I post enough. This will not happen soon because I am too busy with other projects. Please contact me via PM or "mgams@t-online.de". Thank you very much! Matthias
Hello Matthias and all,
Thank you for interest about the EOSC10K4 oscillator project.
I'm still alive even if I'm not so active on DIYaudio these days...
Matthias, I answered you directly to your email.
The EOSC10KV3 design is discontinued and has been replaced
by the upgraded EOSC10KV4 design.
It is fundamentally the same design but with several improvements.
A short list of improvements/modifications below :
The price include worldwide shipping in simple unregistered priority letter (If tracked letter is required add +5€).
Please, use PM to contact me if interested (or my oneaudio email).
As usual I send a very complete design folder with all needed files of the project to build it
without issue (schematics, 1kHz/10kHz operations bom files, manual, assembly guide and more).
You can download the new V4 schematics here (pdf) : EOSC10KV4.01_sch
I planned to make a new thread for this new version, to show all the work made on it.
I have spend much time on characterize the oscillator by measuring performances in various conditions
(temp drift, amplitude drift, THD vs load, THD vs amplitude, etc..).
Anyway, all my documents are not fully ready but I'm confident to make this new thread very soon.
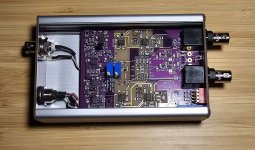
You can see on some pictures below how looks like the new PCB (purple design !)
and the assembled prototypes units.
Best regards.
Frex


Thank you for interest about the EOSC10K4 oscillator project.
I'm still alive even if I'm not so active on DIYaudio these days...
Matthias, I answered you directly to your email.
The EOSC10KV3 design is discontinued and has been replaced
by the upgraded EOSC10KV4 design.
It is fundamentally the same design but with several improvements.
A short list of improvements/modifications below :
- Integrated front and rear panel in PCB design to avoid any mechanical work
and with a beautiful silkscreen and all holes milled. (no stickers needed). - 3 fixed switchable accurate amplitude levels available (front panel dip-switchs)
- one adjustable level up to 20Vpp (SE) or 40Vpp (DIFF).
- External frequency synchronization input (lock-in mode)
- Mini-XLR DC supply input connector
- Optimized total bom cost
- New updated bom
- Design fully merged in Kicad
- Front toggle switch is removed (too expensive and useless)
The price include worldwide shipping in simple unregistered priority letter (If tracked letter is required add +5€).
Please, use PM to contact me if interested (or my oneaudio email).
As usual I send a very complete design folder with all needed files of the project to build it
without issue (schematics, 1kHz/10kHz operations bom files, manual, assembly guide and more).
You can download the new V4 schematics here (pdf) : EOSC10KV4.01_sch
I planned to make a new thread for this new version, to show all the work made on it.
I have spend much time on characterize the oscillator by measuring performances in various conditions
(temp drift, amplitude drift, THD vs load, THD vs amplitude, etc..).
Anyway, all my documents are not fully ready but I'm confident to make this new thread very soon.
You can see on some pictures below how looks like the new PCB (purple design !)
and the assembled prototypes units.
Best regards.
Frex
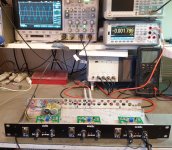
After some blunders with parts, EOSC10KV4 is assembled and performance verified.
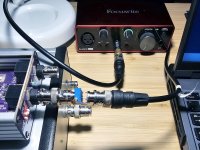
As I use Focusrite Solo ADC, there is a very limited input signal/line-in gain range in which it can measure very low distortion. For that reason, while using large output signal, it was attenuated with trimmer before entering Focusrite input. Signal generator was tested with range of output voltages and it maintains low distortion at all levels. Here is a measurement which puts Focusrite and REW at their limits. All or most distortion is from Focusrite.
Coherent averaging was used.
Attachments
You can't measue noise directly from a spectral line plot, as the FFT bin size and noise-bandwidth of the window function also contribute. And noise is measured as a spectral density (dbV/√Hz). I think you have perhaps about -135dBV/√Hz there, which over 90kHz is perhaps 55µVrms? If you use a fewer bins in the FFT you'll see the noise floor apparently higher because there's more noise energy per bin. You also may be seeing quantization noise in that floor that's masking the true value anyway (ie the ADC may be noisier than the source).As you can see the spectrum plot is very clean, with all spurious much below -120dBV
and noise floor below -140dBV in the full measured bandwidth.
Using calibrated LNA, it appears that 1 kHz generator output has low frequency noise density of about 15 nV/rtHz, and high frequency noise density falls to 6-8 nV /rtHz. That would give total noise in 90 kHz bandwidth at about 3.2 uV, or 2 uV in the 20 Hz – 20 kHz bandwidth.

You can't measure noise like this, its meaningless!
It looks that you have some wrong assumptions about used measurement setup.
Yes, we can measure noise levels with REW spectrum analyzer.
No, results are not meaningless, rather they are very precise.
REW doesn’t have specific noise measurement mode, because it is not required. Algorithm behind spectrum measurement takes in the account used window type and bin width and performs correct summation of measured levels inside every bin. That way, measured total noise levels in the specified bandwidths (22 Hz -22 kHz + existing bandwidth above 22 kHz) displayed in the top right corner or visible noise floor density (V/rtHz), are very correct on condition that calibration is performed before measurement.
Using REW in spectrum mode, LNA and reference noise source, measured noise level is adjusted first, using ADC gain control, to the exact noise of reference source.
As a reference, I use 1499.2 Ω resistor. With LNA input impedance of some 100 kΩ, at 22°C and for 22 Hz-22kHz bandwidth, total nose should be 728 nV or noise density of 4.92 nV/rtHz. With reference resistor at the LNA input, I adjust REW to display exactly 728 nV total noise. OK, it will wander several nV up and down around that value. Of course, noise density is also visible as exactly 4.9 nV/rtHz.
After that calibration, inserting any other value resistor as a noise source will measure exactly what is theoretically expected noise.
So, measured signal generator output noise density is exact value. As there is also signal present, we can’t use values that REW displays at top right window, rather using noise density and bandwidth, we can calculate total noise, excluding signal.
If you still find any error in described method, then please elaborate.
You are close but there is a crucial step still. First, measure the noise with the input shorted. Then with a resistor e.g. 10K. The noise measured with a 10K resistor should work out to Sqrt (En shorted squared + En of 10K resistor (12.7 nV/rtHz) squared). The first step is essential to getting the proper corrections. Your 4.92 nV/rtHz is correct if you have a zero noise amplifier. Maybe a transformer would get there. Otherwise it will be higher. The correction becomes more critical if the resistor noise gets closer to the internal noise. This process is fundamentally accurate. Its how I calibrate the Quan-Tech noise analyzers.
You are absolutely right.
I’m close but I do not follow “lab prescribed” procedure for high noise levels measurement. Input noise of used LNA is 0.445 nV/rtHz. Following the exact procedure, total noise of used reference resistor + LNA noise is 731 nv instead of 728 nV or noise density 4.94 nV/rtHz instead of 4.92. That is within measured noise fluctuation, so it is good enough or “very precise” in DIY terms. For noise measurements at very low levels (about nanovolt noise densities) I do use more precise calibration and LNA noise subtraction from measured result.
I’m close but I do not follow “lab prescribed” procedure for high noise levels measurement. Input noise of used LNA is 0.445 nV/rtHz. Following the exact procedure, total noise of used reference resistor + LNA noise is 731 nv instead of 728 nV or noise density 4.94 nV/rtHz instead of 4.92. That is within measured noise fluctuation, so it is good enough or “very precise” in DIY terms. For noise measurements at very low levels (about nanovolt noise densities) I do use more precise calibration and LNA noise subtraction from measured result.
Ah, I think I understand - it is a spectrum plot, but the total noise is calculated top right? So is the nV/√Hz scale on the graph correct for noise or for peaks? There's scant information about this online for REW when I searched.
When I've plotted spectra I sometimes have a dual mode graph with different axes left and right (done with Python's scipy.signal.welch and matplotlib), for instance:
(red dotted lines go with noise scale on the right - these are just examples the absolute calibration isn't accurate - note how the Hann window's skirts hide the close-in phase noise (or lack of it) compared to a window with good dynamic range and spectral purity like the HFT144D (144dB dynamic range flattop). And of course the Hann window gets the peak tops slightly different due to scalloping error...
- Home
- Design & Build
- Equipment & Tools
- EOSC10Kv3 - LT AN67 10kHz oscillator : new updated version !