....at below -100 dB THD it's not bad at all...
Thanks again. At maximum gain a generated tone higher than -15 dBfs appears to clip the E5 internally. I took one last run taking care to:
- use ASIO as in the previous run
- set the E5's digital output level to maximum
- set all other output sources in the E5's software mixer to minimum and mute
- set the E5's record input level to maximum
- set all other input sources in the E5's software mixer to minimum and mute
A tone of -22 dBfs resulted in minimum indicated distortion at a record level of -9.6 dBfs. Again no harmonic spikes were visible and the THD was around 0.001%. I'm fairly convinced it's a measurement artifact, visually the distortions components are below -110 dB.
It's correct that the bin used for these measurements is very large in order to reveal harmonics so noise shouldn't be taken at face value. Displayed noise also follows the line input mixer setting and might be pointing to a limitation ahead of the AD.
Incidentally, with the output loaded by a 27 ohm IEM at a comfortably loud listening level the distortion at 400 Hz rose to 0.003% pure second. For my use - primarily measuring tube circuits, listening to podcasts over Bluetooth from my tablets, hands-free phone at work, and playing games - I'm deep into the nit-pick weeds here.
Attachments
I think shorted input power level measurement is more interesting measurement of the real noise floor.
Frex
Seems like something that is very asymmetrical with real world use.
Short the input, and no signal can get through?
Termination with a realistic resistance seems more productive.
I think I understand but it will take a while to internalize. So I can try to resolve this in my head does a tone show as its RMS value? And noise of a specific density (rt/hz) show as we would expect?
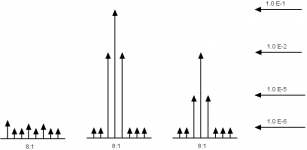
Broadband noise gets its energy is divided up among all or at least many FFT Bins.
A pure wave will be divided up among 1 or 2 bins depending on how its frequency lines up with the center frequency of the relevant bins and the windowing technique that is used.
But this is true regardless of the width of the bins since the pure wave has all of its energy at a single frequency.
Reference: http://www.analog.com/media/en/training-seminars/design-handbooks/MixedSignal_Sect5.pdf
figure 5.25 on page 5.20:
The FFT processing gain is
FFT Processing Gain = 10 log10 (N/2)
= 27dB for N = 1024
= 30dB for N = 2048
= 33dB for N = 4096
Notice that N/2 is the number of FFT bins. Each bin is characterized by two numbers that taken together give either amplitude or phase.
Also please see:
http://www.analog.com/media/en/training-seminars/design-handbooks/MixedSignal_Sect5.pdf
BTW this just scratches the surface of excellent references and training materials at the Analog Devices site. You may familiar names as authors...
I think I understand but it will take a while to internalize.
See also the picture below about FFT Bin compacting...
About detectors you may find some explanations on R&S papers... but not my RMS detector. IMHO it's prior art

And noise of a specific density (rt/hz) show as we would expect?
The noise density remains as it was/is.
Broadband noise gets its energy is divided up among all or at least many FFT Bins.
FFT Processing Gain = 10 log10 (N/2)
= 27dB for N = 1024
= 30dB for N = 2048
= 33dB for N = 4096
The point was, where I started some research on various detectors, that the traditional f(Peak) will NOT show you an exact NOISE FLOOR decrease by -3.0 dB
Hp
Attachments
Seems to be abandoned SW, Nike shoe sales seems to be the thing for the moment.
Their support forum is active...
I could not find the download link for WaveSpectra, and it seems to work for WinXP and earlier?
Use Google Chrome to open the link and get the automatic translation.
Incidentally, the author of Wavespectra is a member here, can't remember his handle , it's how I found out about it in the first place...
Is the FFT processing gain 10*Log 10 (FFT Length /2) or 10*Log 10 (sampling freq /2) ?
I know both formulas exist, but which is correct for processing gain?
Design News - Mechatronics Zone - Where Does FFT Process Gain Come From?
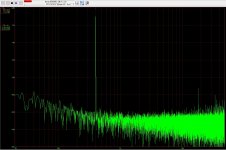
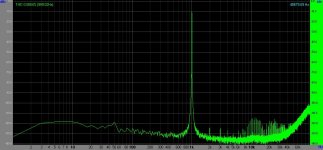
Wish to tell you little about one amazing result with the E-MU 0202. Not far ago got this card from the ebay auction for 30 EUR. I was planning this for my laptop as spectrum measurement tool. This USB sound card uses AK5385 as ADC. The chip is semi compatible with the AK5394, and I thought, that maybe I can replace the ADC chip, if it needed, but seems that is not needed. After one working day, some changes in the buffer amp and little tricks I got wonderful results from the right channel of the ADC. The left channel was more worse (seems that the chip internal problems), and I blocked it. As result I got this relatively small "magic" box, and the nice spectrum picture:
http://content32-foto.inbox.lv/albums/v/viccc/E-MU-0202/0202out.jpg
http://content32-foto.inbox.lv/albums/v/viccc/E-MU-0202/1kHz0202.jpg
http://content32-foto.inbox.lv/albums/v/viccc/E-MU-0202/0202ins.jpg
Victor.
http://content32-foto.inbox.lv/albums/v/viccc/E-MU-0202/0202out.jpg
http://content32-foto.inbox.lv/albums/v/viccc/E-MU-0202/1kHz0202.jpg
http://content32-foto.inbox.lv/albums/v/viccc/E-MU-0202/0202ins.jpg
Victor.
Hello,
The spectrum seem to have fundamental level at 0dBFS, but it need to be confirmed.
I'm very surprised by this results, THD is less than -130dB here and even AK5394 doesn't reach this ! Maybe you fell on the best one
I have a ESI juli@ that have same ADC as E-MU202 (AK5385), and i would be interested to know what mods you have done ?
And also, i'm curious but what is the FFT software do you use ?
Regards.
Frex
Hello,
The spectrum seem to have fundamental level at 0dBFS, but it need to be confirmed.
I'm very surprised by this results, THD is less than -130dB here and even AK5394 doesn't reach this !
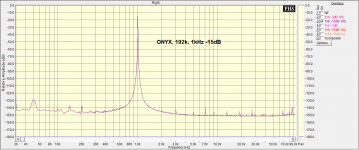
I see -135dB noise floor.
Don;t know about 5385 in this soundcard, but with 5394 it can be expected ~ -150dBFS, so this picture can have 0dB=-15dBFS.
@-15dBFS signal, 5394 have harmonic level ~ -140dBFS (see attachment. @44.1 the results are better).
Attachments
Hi,
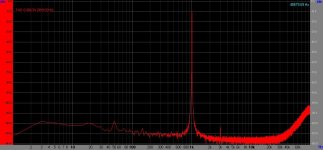
Yes, Alex. You are almost right. 0dB=-16dBFs in my picture. All the soundcards, that I previously had, required offset for the best results in the spectrum measurement. My main internal soundcard Asus Xonar D2 works with -23dB offset...
I am using Spectrum Lab ver. 2.4.0.31. Sampling rate was 192/24 with maximum averaging.
Mainly all changes was done around ADC buffers. High gain and noisy input amps was disconnected. Later, I shall post more detailed information - when I get it in suitable format.
Regards,
Victor.
Yes, Alex. You are almost right. 0dB=-16dBFs in my picture. All the soundcards, that I previously had, required offset for the best results in the spectrum measurement. My main internal soundcard Asus Xonar D2 works with -23dB offset...I am using Spectrum Lab ver. 2.4.0.31. Sampling rate was 192/24 with maximum averaging.
Mainly all changes was done around ADC buffers. High gain and noisy input amps was disconnected. Later, I shall post more detailed information - when I get it in suitable format.
Regards,
Victor.
Hi Victor,
Do you know this topic?
http://www.diyaudio.com/forums/equi...tifacts-peaks-left-channel-7.html#post4175441
EMU USB soundcards is super devices, but its PCB design is not optimal, so need to some modifications (left channel power line redirection).
For years ago I use 0404USB for measuring (Audiotester, Visual Analyser). I use it below -10dB
because over it distortion of input device is growing.
Attachments
Hi Victor,
Do you know this topic?
http://www.diyaudio.com/forums/equi...tifacts-peaks-left-channel-7.html#post4175441
EMU USB soundcards is super devices, but its PCB design is not optimal, so need to some modifications (left channel power line redirection).
For years ago I use 0404USB for measuring (Audiotester, Visual Analyser). I use it below -10dB
because over it distortion of input device is growing.
Hi,
Yes, I heard about this problem in the E-MU 0404. The schematic around the input buffers seems very similar, but the PCB topology probably may be different.
I observed small level spikes in my E-MU 0202 left channel also without the signal, and I could not remove these spikes even if I short circuit the ADC chip left channel inputs. Similar, but lower spikes also was induced to the right channel, before I drastically blocked the left. It was blocked with the big DC offset - one input almost to +5V, other input to GND.
Regards,
Victor.
I was planning this for my laptop as spectrum measurement tool. Victor.
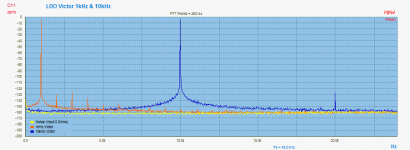
Here some measurements using your lovely LDO's...
And it will always be the hard part with the input LNA & best ADC. And finally for a DIY, to effort such HW/SW or even to build with the existing knowledge such HW.
Hp
Attachments
Last edited:
- Status
- This old topic is closed. If you want to reopen this topic, contact a moderator using the "Report Post" button.
- Home
- Design & Build
- Equipment & Tools
- USB sound card for audio spectrum analysis