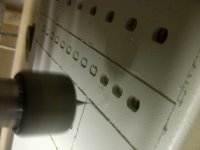
Mine supports tubes on the UX-4, UY-5, loctal, octal as well as 7 and 9 pin miniatures.. I have not elected to support more obscure types and will just make temporary use jigs when such occasions arise.
I have designed and am building an outboard 2 - 3A DC filament supply for 1.5V, 2.5V, 3V, 4V and 5V DHTs to go with mine. For most other types operating on 6.3V or above I will use the internal filament supply.. The outboard filament supply should give me a little more flexibility in terms of measurements relative to the + or - side of the filament supply, and will remove any questions about variations in operating points due to filament voltage considerations.
I have designed and am building an outboard 2 - 3A DC filament supply for 1.5V, 2.5V, 3V, 4V and 5V DHTs to go with mine. For most other types operating on 6.3V or above I will use the internal filament supply.. The outboard filament supply should give me a little more flexibility in terms of measurements relative to the + or - side of the filament supply, and will remove any questions about variations in operating points due to filament voltage considerations.
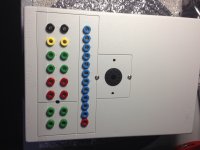
Personaly, I have not selected all support to place on only one box/board, but one socket/one board. One is for noval, one for octal, etc...
Each "support box" owns 2mm miniature safe bananas supporting high voltage.
Like this, I can evoluate by creating a new box for each strange, unknown, forgotten valve support when needed without necessitiy to redo a complex wiring head lock, with lot of parasit capacitors, oscillation risks, but only very very shorts standard 2mm safe bananas
Simple is often the best !
")
That's the approach taken by Tektronix on their curve tracers. And HP on their 4194A impedance/gain-phase analyzer. That's a tried and true way of doing it.
The problem I've had with "universal" testers is that they never support the footprint of the part you want to test.
~Tom
Hello guys,
Personaly, I have not selected all support to place on only one box/board, but one socket/one board. One is for noval, one for octal, etc...
Each "support box" owns 2mm miniature safe bananas supporting high voltage.
Like this, I can evoluate by creating a new box for each strange, unknown, forgotten valve support when needed without necessitiy to redo a complex wiring head lock, with lot of parasit capacitors, oscillation risks, but only very very shorts standard 2mm safe bananas
Simple is often the best !
Best Regards,
Francois/France
This is good advice Francois. I will play around with this concept and see if it will work for me.
Mine supports tubes on the UX-4, UY-5, loctal, octal as well as 7 and 9 pin miniatures.. I have not elected to support more obscure types and will just make temporary use jigs when such occasions arise.
I have designed and am building an outboard 2 - 3A DC filament supply for 1.5V, 2.5V, 3V, 4V and 5V DHTs to go with mine. For most other types operating on 6.3V or above I will use the internal filament supply.. The outboard filament supply should give me a little more flexibility in terms of measurements relative to the + or - side of the filament supply, and will remove any questions about variations in operating points due to filament voltage considerations.
Hello Kevin, Check out Ronald's latest blog entry. If you haven't already seen it, you will be happy to know that he has released a revision to the GUI that improves the Utracers high current, low heater voltage measurement capabilities.
http://www.dos4ever.com/uTracerlog/V3p7H_exe_only.zip
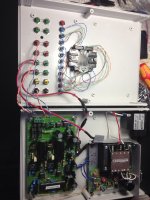
Finally got mine all wired up and calibrated today -- i would suggest using some through-hole inductors, or reflowing the L1,2,3,4. If not, I suggest mounting the inductors first. Will have some pix on how to arrange this.
I've been using my Tektronix 576, taking a digital pic and using graph-grabber to get a CSV file -- the UTracer may make my life easier!
Edit: For EUR195 this is a steal!
I've been using my Tektronix 576, taking a digital pic and using graph-grabber to get a CSV file -- the UTracer may make my life easier!
Edit: For EUR195 this is a steal!
Last edited:
Check out Nick Barton's alternative GUI as well. I especially like the pinout documentation feature and the graphing quality.
Black Magic Amplifiers
Black Magic Amplifiers
i was thinking that of using a "true RMS converter" from Linear or ADI to measure the heater voltage and create a correction algorithm -- to get 6.3V RMS on the heater I have to set the voltage to 7.0. Ron talks about issues with low voltage high current heater values -- measure the Z @19.5kHz with the short pulse width makes for something other than a purely resistive load. noise measured with the ADI and Linear Tech True RMS chips measures well -- compared to my HP3403C -- but I don't know if a pulse-train will be as easily measured.
Iirc, the earlier versions were limited to smaller tubes?
So, I did write to him and ask about this limitation, upon which the replies were a bit terse. But then apparently, the latest version will handle larger power tubes. Hmmm... Well, so what, eh?
Anyhow so I looked again at the site and see the "new" version and am thinking to myself, gee this is pretty darn good now, I should get one. Get one, build it and run through some boxes of tubes!
A few days later and I am thinking, ok so if I run through 20 tubes (for example) how am I to keep track of which curves are for which tubes? Do I have to manually save screen shots and then label them? Wait as second, isn't this a *computer* based system? I looked but could not see if there was a way to save, store, sort and importantly OVERLAY (within reason) tube curves?
Maybe this is already there, but I did not come across it. Anyone?
_-_-
PS. a polite email about this idea was not answered...
Considering it is a spare time activity and rather inexpensive I think you get rather a lot of functionality for what you pay. There is an alternative GUI (linux version too) from Nick Barton, and the standard GUI has just been upgraded. Like all such projects it is a work in progress. I have one and would recommend it unhesitatingly.
I am an Excel ignoramus. Can or will Excel do the "overlay"trick without having to do all sorts of "magic incantations" back inside the spreadsheet? (There is no "front end" for Excel is there??)
In the versions of Excel today you get a CSV (comma separated value) file which parses itself into a simple set of spreadsheet values. In the old days you had to identify where the rows and columns should start.
The MSOffice allows you to mouse over the data and insert it into a graph. I'll try to do a youtube and show you how to overlay two or more sets of data.
I measured the duty cycle and RMS output of the heater circuit. The duty cycle measurement is not that accurate at low voltages, but good enough for government work which is why the lines aren't perfectly parallel. The actual vs regressed lines slope a little differently due to the resistive elements in the circuit.
I had a math mistake in the other chart I had posted, so took it down.
An externally hosted image should be here but it was not working when we last tested it.
I had a math mistake in the other chart I had posted, so took it down.
and if we only concern ourselves with voltages of 7V or less (I do use 7N7's!):
All of the above depends upon the supply voltage and stray inductance. at really low heater voltages, as Ronald points out on his blog, the duty cycle is very short, dv/dt is very high, etc., etc.
An externally hosted image should be here but it was not working when we last tested it.
All of the above depends upon the supply voltage and stray inductance. at really low heater voltages, as Ronald points out on his blog, the duty cycle is very short, dv/dt is very high, etc., etc.
- Home
- Design & Build
- Equipment & Tools
- uTracer...