This is about a partially filtered non os DAC.
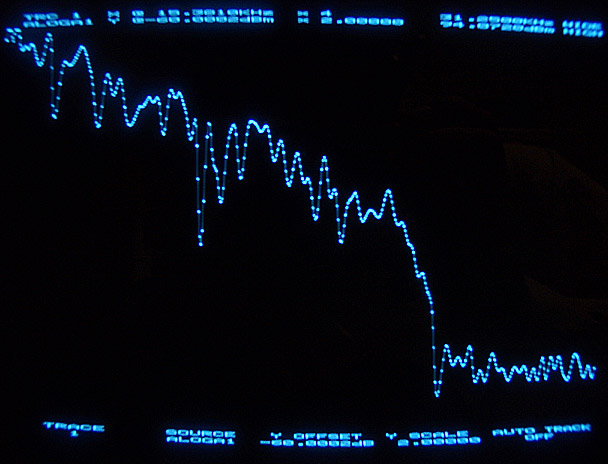
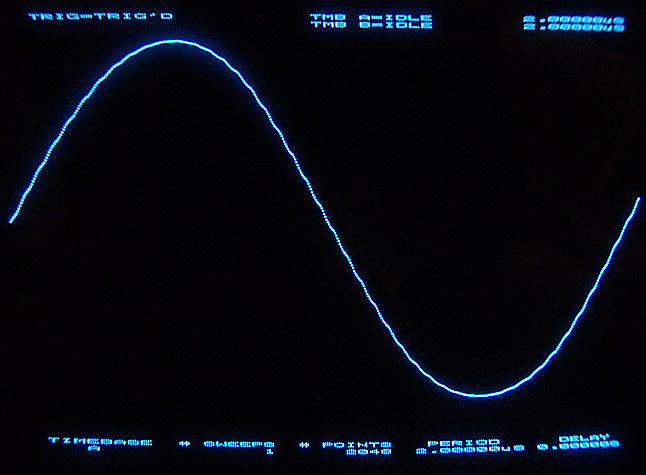
First, music signal from an oversampling CD player, 31 kHz analyzer bandwith.
It can be seen the CD bandwith limitation of 22,5 kHz.
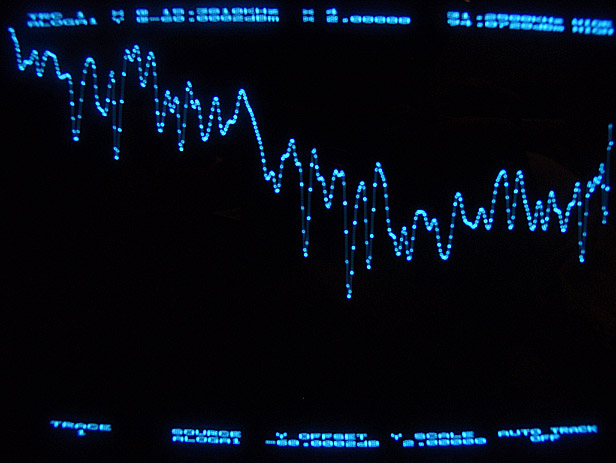
Now the transformer + cap filtered non os DAC.
The empty space above 22,5 kHz is filled with harmonics.
Non os gives back a little of what the CD format has taken away.
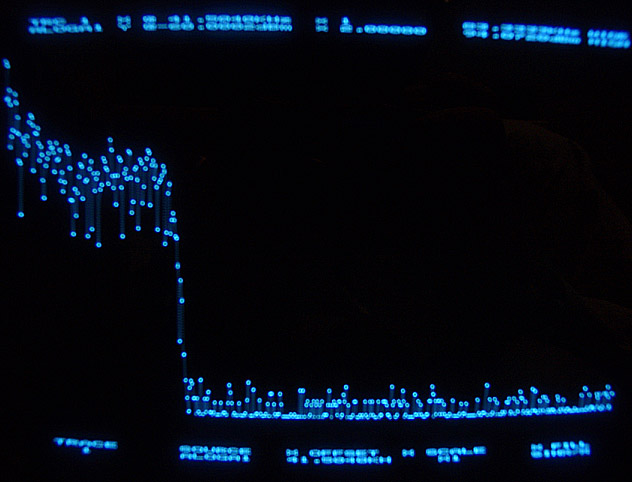
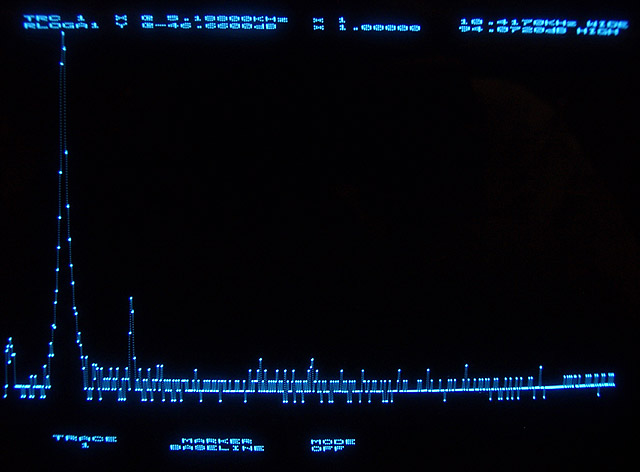
Pink noise from CD with oversampling, 83 kHz analyzer bandwith.
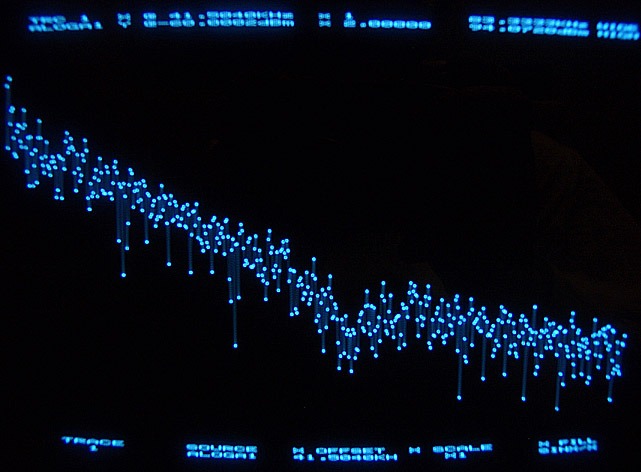
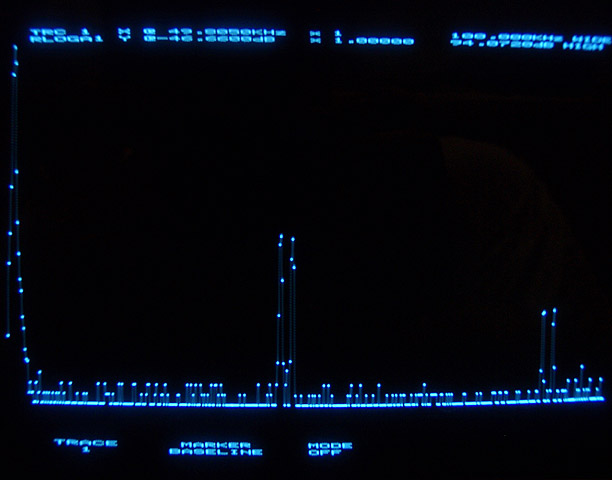
Pink noise from CD with non os DAC.
It can be seen, at 80 kHz HF is pretty much down.
That should not be a problem for a good amplifier.
First, music signal from an oversampling CD player, 31 kHz analyzer bandwith.
It can be seen the CD bandwith limitation of 22,5 kHz.
Now the transformer + cap filtered non os DAC.
The empty space above 22,5 kHz is filled with harmonics.
Non os gives back a little of what the CD format has taken away.
Pink noise from CD with oversampling, 83 kHz analyzer bandwith.
Pink noise from CD with non os DAC.
It can be seen, at 80 kHz HF is pretty much down.
That should not be a problem for a good amplifier.
Bernhard said:The empty space above 22,5 kHz is filled with harmonics.
Non os gives back a little of what the CD format has taken away.
These aren't harmonics, and thus these aren't what 'the CD format has taken away'.
Bernhard said:Same with 100 kHz analyzer bandwith, the 44,1kHz and 88,2 kHz are split, jitter
Baseband frequency f creates images at every N*fs+f and N*Fs-f,
so 1kHz has images at
44.1kHz-1kHz
44.1kHz+1kHz
88.2kHz-1kHz
88.2kHz+1kHz
...
Werner said:
Baseband frequency f creates images at every N*fs+f and N*Fs-f,
so 1kHz has images at
44.1kHz-1kHz
44.1kHz+1kHz
88.2kHz-1kHz
88.2kHz+1kHz
...
Thanks

Still, there is something above 22 kHz and maybe it makes a difference. Perhaps.
- Status
- This old topic is closed. If you want to reopen this topic, contact a moderator using the "Report Post" button.