I have come to realize some more caveats are worth mentioning here.
One of the largest issue I had so far was when my DAP1002 stopped functioning entirely. 'Stand by' dim red light comes up, the CPU accepts one short click for power on, CPU runs the white LEDs around volume knob, and the previous volume position is indicated by the white LED fine. But no sound came out of the amplifier at all.
Then I found that connecting the USBi Programmer to the amp and to the PC, and doing "Link Compile Download" in Sigma Studio (after making sure SPI or I2C protocol is working), restored the working condition so that sound came out of the amp fine. But when I disconnected the programmer, the amp went back to the non-functioning state. So I was stuck with the amp that required a USBi Programmer and Sigma Studio to play music.
This apparently happens when:
1. "Link Compile Download" is done when DAP1002 is in stand-by mode.
2. DAP1002 is powered back on and "Write Latest Compilation to E2Prom" is done.
And since the stand-by mode is unique to DAP1002/2002, I couldn't find any solution anywhere on the Internet.
Here is the solution I finally found, though I am certain it is not the only and correct solution:
1. Start up Sigma Studio, load a project, and click "Hardware Configuration" tab.
2. Connect a powered up DAP1002, USBi Programmer and PC.
3. Right click on "ADAU1701 IC 2" Panel, select Register Window.
4. Move the Register Window so that you can see the 'Capture' pane in the middle bottom of the main window.
5. Check "Force By SPI" checkbox in "Interface Register" pane on the middle bottom of Register Window.
6. Make sure you see some data (00 and 5C on the below pic) is written to Address 2076 (0x081C) on the Capture pane.
7. Uncheck "Force By SPI" checkbox.
8. Make sure you see '00' and '1C' data are written to Address 2076 (0x081C).
9. Do a Link Compile Download, and "Write Latest Compilation to E2Prom".

The window on the left in the above pic is the Register Read/Write window, which appears when you right click "ADAU1701 IC 2" pane and select "Register Read/Write". It is showing
0
5C
when reading 2 bytes on Address 2076. When you do this read on a non-functioning DAP1002, the data may be 08 1C, 53 1C, 58 1C or something like it.
This problem can be avoided if we don't let DAP1002 go into stand-by while being connected to USBi Programmer and Sigma Studio.
`
One of the largest issue I had so far was when my DAP1002 stopped functioning entirely. 'Stand by' dim red light comes up, the CPU accepts one short click for power on, CPU runs the white LEDs around volume knob, and the previous volume position is indicated by the white LED fine. But no sound came out of the amplifier at all.
Then I found that connecting the USBi Programmer to the amp and to the PC, and doing "Link Compile Download" in Sigma Studio (after making sure SPI or I2C protocol is working), restored the working condition so that sound came out of the amp fine. But when I disconnected the programmer, the amp went back to the non-functioning state. So I was stuck with the amp that required a USBi Programmer and Sigma Studio to play music.
This apparently happens when:
1. "Link Compile Download" is done when DAP1002 is in stand-by mode.
2. DAP1002 is powered back on and "Write Latest Compilation to E2Prom" is done.
And since the stand-by mode is unique to DAP1002/2002, I couldn't find any solution anywhere on the Internet.
Here is the solution I finally found, though I am certain it is not the only and correct solution:
1. Start up Sigma Studio, load a project, and click "Hardware Configuration" tab.
2. Connect a powered up DAP1002, USBi Programmer and PC.
3. Right click on "ADAU1701 IC 2" Panel, select Register Window.
4. Move the Register Window so that you can see the 'Capture' pane in the middle bottom of the main window.
5. Check "Force By SPI" checkbox in "Interface Register" pane on the middle bottom of Register Window.
6. Make sure you see some data (00 and 5C on the below pic) is written to Address 2076 (0x081C) on the Capture pane.
7. Uncheck "Force By SPI" checkbox.
8. Make sure you see '00' and '1C' data are written to Address 2076 (0x081C).
9. Do a Link Compile Download, and "Write Latest Compilation to E2Prom".
The window on the left in the above pic is the Register Read/Write window, which appears when you right click "ADAU1701 IC 2" pane and select "Register Read/Write". It is showing
0
5C
when reading 2 bytes on Address 2076. When you do this read on a non-functioning DAP1002, the data may be 08 1C, 53 1C, 58 1C or something like it.
This problem can be avoided if we don't let DAP1002 go into stand-by while being connected to USBi Programmer and Sigma Studio.
`
Another caveat which may be discussed elsewhere as well, is the 1Vrms RCA input design of DAP1002/2002.
..Line levels and their approximate nominal voltage levels:
:
........Use............Nominal level...Nom.Lev.Vrms...Peak,Vpk...Peak-to-peak,Vp-p
Professional audio......+4 dBu........1.228............1.736...........3.472
Consumer audio.......−10 dBV........0.316............0.447...........0.894(sorry it's difficult to read this table.
tag doesn't work here as it's supposed to.)
Many DAC and other modern equipment follow the Sony and Philips practice of using the Pro audio standard for consumer audio gear. They agreed many years ago that this practice helps improve the sound quality in consumer electronics. However, old standard die hard, and when an engineer is faced with design restrictions like extracting long playback time out of a charge in a small battery, he/she is tempted to use the old consumer standard, which is still valid today.
As a result, there are a huge number of products out in the market (likely more than 100 or 1000 times the number of separate DACs) that output only up to 0.9Vp-p. Probably because it is easier to attenuate a higher level signal down than amplifying a lower level signal up, the RCA input on DAP1002/2002 has a high sensitivity that clips at 1.095V or so which is good for the above Consumer audio standard, but will clip and distort when the Pro audio standard level is fed.
Many DACs have a built-in Pre-Amp Mode that allows its volume control to lower the output level, but if you don't want to use that, here is what you do:

©3e Audio This applies to both DAP1002 and DAP2002.
Remind you, swapping two SMD resistors require some desoldering/soldering skills, and there is not much point in reducing the sensitivity beyond 2V.
`
..Line levels and their approximate nominal voltage levels:
........Use............Nominal level...Nom.Lev.Vrms...Peak,Vpk...Peak-to-peak,Vp-p
Professional audio......+4 dBu........1.228............1.736...........3.472
Consumer audio.......−10 dBV........0.316............0.447...........0.894
Many DAC and other modern equipment follow the Sony and Philips practice of using the Pro audio standard for consumer audio gear. They agreed many years ago that this practice helps improve the sound quality in consumer electronics. However, old standard die hard, and when an engineer is faced with design restrictions like extracting long playback time out of a charge in a small battery, he/she is tempted to use the old consumer standard, which is still valid today.
As a result, there are a huge number of products out in the market (likely more than 100 or 1000 times the number of separate DACs) that output only up to 0.9Vp-p. Probably because it is easier to attenuate a higher level signal down than amplifying a lower level signal up, the RCA input on DAP1002/2002 has a high sensitivity that clips at 1.095V or so which is good for the above Consumer audio standard, but will clip and distort when the Pro audio standard level is fed.
Many DACs have a built-in Pre-Amp Mode that allows its volume control to lower the output level, but if you don't want to use that, here is what you do:
©3e Audio This applies to both DAP1002 and DAP2002.
Remind you, swapping two SMD resistors require some desoldering/soldering skills, and there is not much point in reducing the sensitivity beyond 2V.
`
As you stated, the 1Vrms input value of the DAP1002/2002 (and also 3e’s standalone DSP board) is the 0 dBFS value: go beyond 1 Vrms and they clip. While the consumer audio NOMINAL value is 0.316 Vrms, the maximum value can be 2 Vrms (see LINK). So it’s possible to clip the 3e Audio products with a consumer audio line level signal. A lot of DACs (at least the ones I’ve used) also have a maximum output of 2 Vrms.
I stated previously that the linker and the compiler in Sigma Studio work very well and I haven't seen an error thrown by either of the two. I recently faced such an error, and it seems the error may be rooted in one of the under-developed areas of the IDE, the Graphical User Interface.

The above Linker fatal error on Sigma Studio Rev.4.6 was thrown when:
1. System sampling rate is set to 192kHz.
2. A double precision Nth order filter in Tree Toolbox was clicked and dragged over to the Schematic main pane.
3. When the mouse button was released to drop the filter in the Schematic area, it seemed the filter block was loaded into the memory, but the filter block GUI (icon) did not appear.
4. Link Compile Download (or Link Compile Connect) was done.
As the system sampling rate was 192kHz and there were other blocks in the Schematic, it is probable that the hardware limit was exceeded by adding the Nth order filter block.
Anyway, when the above situation happens and if you are not aware of the "filter was loaded into the memory" part of the above step #3, you will have no idea why this error occurred or how to solve the problem, as what you see on the screen does not tell you a clue about what's going on. (All the components and signal terminals in Schematic could appear connected despite what the error message tells you.)
My solution is to click and diagonally drag the empty area of Schematic where the "unsuccessfully dropped" block was when the mouse button was released at the end of the drag and drop operation. This will give you a rectangle of dotted lines covering the area, and selects any visible or invisible block in it. If you don't have any idea where on the Schematic this unsuccessful drop occurred, you may have to do try-and-error at several empty areas.
Once this is done successfully and see the rectangle, you can right-click and select Delete to remove the problematic block(s) from the memory. This trick can also be used when you have problems removing fragments of a block from Schematics after right-clicking its icon and selecting Delete, which happened on me trying to remove a 'T' connector that kept on leaving a fragment of the icon on the screen.
So the above 'LinkWind' (linker window) pic is worth keeping in mind for when you face a similar situation. Otherwise you could get stuck in the "unable to Link Compile Download" state for days.
`
In order to use an advanced DSP like this ADAU1701 effectively, we need to understand the concept of phase.
All speakers, amplifiers and DSPs introduce delay into the audio signal. When the total delay in the signal path is 1ms or 1 second across the board from 20Hz to 20kHz, there is no effect on sound quality. We may hear the sound 1ms or 1sec late, but since most of the music we listen to are pre-recorded, this is not a problem. There is a built-in fixed delay (called the latency) in the chain of ADC-DSP-DAC in ADAU1701 (52 samples at 48kHz sample rate, or about 1.1ms) that is always present.
But the problem for high fidelity reproduction is, the delay comes up small for certain frequency and large for another. Unlike the often-talked-about frequency response curve across the audio frequency spectrum, this unequal delays for frequency bands may be difficult to conceptualize, but it is very audible as demonstrated in this video:
Allpass Filter tricks! - YouTube
Ignorance can be bliss, so if we want to hide behind the statement "flatter frequency response always sounds better", may be we are better off not listening to the above video with a good set of headphones, and never click the 'Phase' tab in Sigma Studio probe/graph functions.
Our efforts to use more number of filters to flatten the frequency response, inject more and more unequal delays for different frequencies that result in phase distortion, which might sound interesting for Desk Top Music composition as demonstrated in the video, but is terrible for hifi reproduction.
DSP filters (just like a speaker crossover circuit or tone/loudness control) have strong effect on the distortion, so the use of a powerful DSP like ADAU1701 without understanding phase is like trying to use a hatchet to remove a brain tumor.

The above is the 48kHz sampling rate Phase response curve of a 5 filter AutoEQ correction made by feeding my Revel F35 REW measurement file with a flat target response for 30-20kHz.
Because a certain frequency wave gets cancelled and become inaudible when mixed with the same frequency wave with a half wavelength delay, the effect of the distortion is measured more conveniently in the angle within the full cycle of the wave, and this angle is called the 'phase'.
20Hz sound wave takes 1/20=0.05sec (50ms) for one cycle (360 degrees or 2 x Pi Radian). So the 28 radian delay for 20Hz in the above graph is:
28 / 2 / 3.1416 x 360 = 1604.28° (degrees, nearly 4.5 cycles) or
0.05 x 1604 / 360 = 0.223 seconds.
As the phase difference of -78 radian at 67Hz (185ms) or so and 60 radian at 180Hz (53ms) is quite large, we might be able to see not only the above delay at 20Hz but also this 67 to 180Hz effect of adding the AutoEQ filters is quite audible as distortion.
This is the technical background info that supports my previous statement "As close as possible to making it flat" approach does not give me the best listening pleasure.
`
All speakers, amplifiers and DSPs introduce delay into the audio signal. When the total delay in the signal path is 1ms or 1 second across the board from 20Hz to 20kHz, there is no effect on sound quality. We may hear the sound 1ms or 1sec late, but since most of the music we listen to are pre-recorded, this is not a problem. There is a built-in fixed delay (called the latency) in the chain of ADC-DSP-DAC in ADAU1701 (52 samples at 48kHz sample rate, or about 1.1ms) that is always present.
But the problem for high fidelity reproduction is, the delay comes up small for certain frequency and large for another. Unlike the often-talked-about frequency response curve across the audio frequency spectrum, this unequal delays for frequency bands may be difficult to conceptualize, but it is very audible as demonstrated in this video:
Allpass Filter tricks! - YouTube
Ignorance can be bliss, so if we want to hide behind the statement "flatter frequency response always sounds better", may be we are better off not listening to the above video with a good set of headphones, and never click the 'Phase' tab in Sigma Studio probe/graph functions.
Our efforts to use more number of filters to flatten the frequency response, inject more and more unequal delays for different frequencies that result in phase distortion, which might sound interesting for Desk Top Music composition as demonstrated in the video, but is terrible for hifi reproduction.
DSP filters (just like a speaker crossover circuit or tone/loudness control) have strong effect on the distortion, so the use of a powerful DSP like ADAU1701 without understanding phase is like trying to use a hatchet to remove a brain tumor.
The above is the 48kHz sampling rate Phase response curve of a 5 filter AutoEQ correction made by feeding my Revel F35 REW measurement file with a flat target response for 30-20kHz.
Because a certain frequency wave gets cancelled and become inaudible when mixed with the same frequency wave with a half wavelength delay, the effect of the distortion is measured more conveniently in the angle within the full cycle of the wave, and this angle is called the 'phase'.
20Hz sound wave takes 1/20=0.05sec (50ms) for one cycle (360 degrees or 2 x Pi Radian). So the 28 radian delay for 20Hz in the above graph is:
28 / 2 / 3.1416 x 360 = 1604.28° (degrees, nearly 4.5 cycles) or
0.05 x 1604 / 360 = 0.223 seconds.
As the phase difference of -78 radian at 67Hz (185ms) or so and 60 radian at 180Hz (53ms) is quite large, we might be able to see not only the above delay at 20Hz but also this 67 to 180Hz effect of adding the AutoEQ filters is quite audible as distortion.
This is the technical background info that supports my previous statement "As close as possible to making it flat" approach does not give me the best listening pleasure.
`
Now that I accept the fact that using many filters with strong boost up or down is harmful for sound quality, what should I do?
Just like in many other design criteria in audio system, this is a tradeoff (between frequency response and phase distortion), and there can be infinite number of choice combinations and strategies.
There are some theories on how to tackle the issue like:
Algorithms for the Constrained Design of Digital
Filters with Arbitrary Magnitude and Phase Responses
but automatic optimization of phase is far beyond the reach of Sigma Studio (yet).
Speaker crossover circuit is a combination of high pass and low pass filters, that operate under the same principle and limitations as a filter in DSPs.
All hifi speaker manufacturers recognize the importance of phase, and some have started using AI to find the best compromise in driver/crossover designs. When they are confident that their solution cannot be bettered by amateur use of upstream crossover/dsp, or when they value the know-how used in design/manufacturing of crossover circuits very highly, the manufacturer tends not to offer direct access to individual tweeter/woofer terminals in the final product in my opinion. (e.g. my Revel F35 has four speaker units and only one set of speaker cable terminals per side)
Here is one of my trials:

When I used Sigma Studio for the first time, I was glad to see two kinds of Dynamic Bass Boost functionality built-in on ADAU1701, because having a loudness control at low volume level and making it automatically stronger as the volume becomes lower is something I always wished I had. However, these pre-built modules make the sound so bad to my ears no matter how I configured it especially when the delay (response time setting) is set low. So I had to make my own dynamic bass boost using the volume level index available on the Log Volume prototype .dspprj provided by 3e Audio for DAP2002. They assured me the DAP2002 file is different to 1002 only in the output power limiter settings, which does not matter to me as I never use the amp close to its max volume even with the lower output of TPA3250 over 3255. The only problem is the file comes with Automatic Stand By (ASB) that cannot be removed. Theory says human ears lose sensitivity at lower volume for high and low frequency bands, but somehow the highs in low volume never bothered me as much, probably because the lower sensitivity to high frequency almost never makes any particular instrument disappear from the soundstage.

The 125Hz setting of the dynamic bass boost filter is a lot higher in frequency than I would have liked, but was chosen for phase. The addition of one All Pass filter at 8800Hz is also for phase control. Please note the plus and minus 3dB boost at lower frequencies and 5dB at 9000Hz are a lot lower level than what AutoEQ suggested.
`
Just like in many other design criteria in audio system, this is a tradeoff (between frequency response and phase distortion), and there can be infinite number of choice combinations and strategies.
There are some theories on how to tackle the issue like:
Algorithms for the Constrained Design of Digital
Filters with Arbitrary Magnitude and Phase Responses
but automatic optimization of phase is far beyond the reach of Sigma Studio (yet).
Speaker crossover circuit is a combination of high pass and low pass filters, that operate under the same principle and limitations as a filter in DSPs.
All hifi speaker manufacturers recognize the importance of phase, and some have started using AI to find the best compromise in driver/crossover designs. When they are confident that their solution cannot be bettered by amateur use of upstream crossover/dsp, or when they value the know-how used in design/manufacturing of crossover circuits very highly, the manufacturer tends not to offer direct access to individual tweeter/woofer terminals in the final product in my opinion. (e.g. my Revel F35 has four speaker units and only one set of speaker cable terminals per side)
Here is one of my trials:
When I used Sigma Studio for the first time, I was glad to see two kinds of Dynamic Bass Boost functionality built-in on ADAU1701, because having a loudness control at low volume level and making it automatically stronger as the volume becomes lower is something I always wished I had. However, these pre-built modules make the sound so bad to my ears no matter how I configured it especially when the delay (response time setting) is set low. So I had to make my own dynamic bass boost using the volume level index available on the Log Volume prototype .dspprj provided by 3e Audio for DAP2002. They assured me the DAP2002 file is different to 1002 only in the output power limiter settings, which does not matter to me as I never use the amp close to its max volume even with the lower output of TPA3250 over 3255. The only problem is the file comes with Automatic Stand By (ASB) that cannot be removed. Theory says human ears lose sensitivity at lower volume for high and low frequency bands, but somehow the highs in low volume never bothered me as much, probably because the lower sensitivity to high frequency almost never makes any particular instrument disappear from the soundstage.
The 125Hz setting of the dynamic bass boost filter is a lot higher in frequency than I would have liked, but was chosen for phase. The addition of one All Pass filter at 8800Hz is also for phase control. Please note the plus and minus 3dB boost at lower frequencies and 5dB at 9000Hz are a lot lower level than what AutoEQ suggested.
`
I found a rather shocking bug in Sigma Studio.
When there is a fixed time delay like 1ms or 1 second in audio signal across the board from 20 to 20kHz, the phase response graph should show a declining straight line,
as 20ms at 20Hz is:
0.02 / (1 / 20) x 360 = 144 degrees or 2.513 radian
20ms at 400Hz is:
0.02 / (1 / 400) x 360 = 2,880 degrees or 50.26 radian
20ms at 800Hz is:
0.02 / (1 / 800) x 360 = 5,760 degrees or 100.53 radian
and 20ms at 20kHz is:
0.02 / (1 / 20000) x 360 = 144,000 degrees or 2513.3 radian
But below is the phase response graph of a 20ms delay on Sigma Studio Version 4.6 Build 0 Rev. 1812:

The line on the graph appears as a declining curve instead of a straight line because the X axis scale is logarithmic, which is correct. But despite the graph indicating "radians" on the Y axis and "IN1: phase(rad)", the Y axis unit obviously is Degrees and not radians, as you could see by comparing the above calculations to the graph.
Apparently this simple but serious bug has been there since 2018:
SigmaStudio Probe phase units: Radians or Degrees? - Q&A - SigmaDSP Processors and SigmaStudio Development Tool - EngineerZone
Shame on you, ADI.
Moreover, the circled area in red on the graph is totally wrong as:
20ms delay at 1000Hz is:
0.02 / (1 / 1000) x 360 = 7,200 degrees or 125.7 radian, not even close to about 5000 indicated on the graph.
In any event, it is important to remember that a fixed delay across the board 20-20kHz appears as a declining straight line (or a declining log curve on a log scale), which does not degrade the sound quality.
`
When there is a fixed time delay like 1ms or 1 second in audio signal across the board from 20 to 20kHz, the phase response graph should show a declining straight line,
as 20ms at 20Hz is:
0.02 / (1 / 20) x 360 = 144 degrees or 2.513 radian
20ms at 400Hz is:
0.02 / (1 / 400) x 360 = 2,880 degrees or 50.26 radian
20ms at 800Hz is:
0.02 / (1 / 800) x 360 = 5,760 degrees or 100.53 radian
and 20ms at 20kHz is:
0.02 / (1 / 20000) x 360 = 144,000 degrees or 2513.3 radian
But below is the phase response graph of a 20ms delay on Sigma Studio Version 4.6 Build 0 Rev. 1812:
The line on the graph appears as a declining curve instead of a straight line because the X axis scale is logarithmic, which is correct. But despite the graph indicating "radians" on the Y axis and "IN1: phase(rad)", the Y axis unit obviously is Degrees and not radians, as you could see by comparing the above calculations to the graph.
Apparently this simple but serious bug has been there since 2018:
SigmaStudio Probe phase units: Radians or Degrees? - Q&A - SigmaDSP Processors and SigmaStudio Development Tool - EngineerZone
Shame on you, ADI.
Moreover, the circled area in red on the graph is totally wrong as:
20ms delay at 1000Hz is:
0.02 / (1 / 1000) x 360 = 7,200 degrees or 125.7 radian, not even close to about 5000 indicated on the graph.
In any event, it is important to remember that a fixed delay across the board 20-20kHz appears as a declining straight line (or a declining log curve on a log scale), which does not degrade the sound quality.
`
On the left is the phase response curve as my speakers are measured from the listening position. On the right is the phase response of the previously shown 5 filter Parametric EQ + All Pass Filter at 8,800Hz.

The All Pass filter effect on the phase is rather obvious on the graph on the right from 4,000Hz to 5,000Hz, but the phase effect of the Parametric EQ may also be noticeable with two slightly visible dips, first at about 32Hz and the second at about 250Hz, which becomes more obvious when the Y axis scale is made smaller.
My strategy in this trial was to make the dips in filter phase curve coincide with a 'rise' in the speaker phase response, treating any rise (or an unchanging flat state on a log scale, as frequency goes up) to be unnatural and something to be avoided or countered with a filter.
The zigzag line on the left graph from 2,000Hz to 10,000Hz shows the phase not changing much on the average in that wide frequency range. So the addition of all pass filter at 8,800Hz is meant to artificially add delay at 4,000 to 5,000Hz in the middle of that range.
With the relatively flat phase response, which was due to the filters of plus and minus 3dB boost at low frequencies and 5dB boost at 8,000Hz, and the added all pass delay in 4 to 5,000Hz range, combined with a flatter frequency response (as the weaker-boost filters are placed where AutoEQ suggested), the strategy seemed fine and well thought out.
However, upon directly comparing this with a no-filter sound, the no-DSP state won with so much more natural and beautiful sound quality hands down.
May be my use of all pass filter was totally wrong in aiming for "the middle" of the flat (non-declining phase) frequency range of 2,000 - 10,000Hz, so that I should have used a much smaller Q (may be about 2, instead of 6) to make the delay slope covering a wider frequency range (3,000-6,000Hz instead of the 4,000-5,000Hz shown in the graph on the right).
Also, there is the question of how reliable these 'simulated' phase response graphs are in the evaluation of actual sound. This unproven territory might be similar to "how do we explain a fabulously sounding set of speakers with terrible frequency response" in the old days. I wouldn't be surprised if a pair of 20-year-old high-end speakers showing a much better-looking frequency response (but likely with a much worse-looking phase response) than my Revel.
I conducted the comparison at the same volume level that is loud enough so that there should be no effect from the dynamic bass boost, but I don't really know if there could be some effect of it by using up more resources at ADAU1701, as the system sampling rate is set at 96kHz. I am convinced AU1701 sounds better at a higher sampling rate than 48kHz, especially when the load on it is light. At the same time, doubts have grown in my head as to how reliable the resource usage 'estimate' figures are in the Sigma Studio compiler output file, in making the judgement if a certain level of resource usage is OK.
`
The delay control in SigmaStudio certainly has some bugs. I’ve managed to work around most of its problems if I follow these steps:
-Drag the control on the schematic field. Immediately change from “Samples” to “milliseconds” and then set the maximum value. The drop down maximum value list should be from 1 to 43 milliseconds (this may be sampling dependent, I’m sampling at 48 KHz). Then set your delay time and wire it to your schematic.
- If the max value ever goes blank (as in your post #68) the control is messed up. The only way I can recover is to delete the control, save the project, reopen the project and start over.
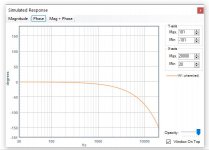
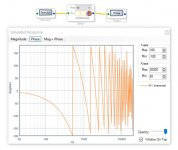
- I always get the wrong response the first time I click the Stimulus (first attachment). The second time I click I get the expected response (second attachment).
A few notes:
1. I’m not sure why I get degrees while you get radians for phase. I’m using Version 4.5, Build 0, Rev 1779 dated 10/28/2019.
2. In the second attachment each phase wrap (-180 to +180) trace should go all the way to the edge of the graph. The “Probe” control doesn’t plot at small enough frequency steps to catch the exact wrap frequencies.
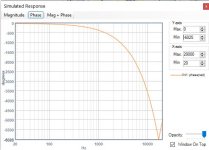
3. The third attachment shows the same delay with phase unwrapped.
Hope this helps…
-Drag the control on the schematic field. Immediately change from “Samples” to “milliseconds” and then set the maximum value. The drop down maximum value list should be from 1 to 43 milliseconds (this may be sampling dependent, I’m sampling at 48 KHz). Then set your delay time and wire it to your schematic.
- If the max value ever goes blank (as in your post #68) the control is messed up. The only way I can recover is to delete the control, save the project, reopen the project and start over.
- I always get the wrong response the first time I click the Stimulus (first attachment). The second time I click I get the expected response (second attachment).
A few notes:
1. I’m not sure why I get degrees while you get radians for phase. I’m using Version 4.5, Build 0, Rev 1779 dated 10/28/2019.
2. In the second attachment each phase wrap (-180 to +180) trace should go all the way to the edge of the graph. The “Probe” control doesn’t plot at small enough frequency steps to catch the exact wrap frequencies.
3. The third attachment shows the same delay with phase unwrapped.
Hope this helps…
Attachments
Yes, indeed. Thank you for the tips. In trying the tips, I found the radian vs. degree option, too, but was struggling how to screen capture it. Did you use keyboard shortcut keys?
I got the following after clicking Stimulus twice and selecting degrees, and clicking for the 3rd and 4th time did not change it at all:

Note: Apart from the odd scale automatically selected for the X axis, it says "IN2: phase(rad)" and 'degrees' indicated on Y axis.
So we need to keep in mind phase areas of Sigma Studio are riddled, or at least sprinkled with bugs.
This goes back to the question, "How reliable are these figures/graphs?". I guess I need to rely on my ears to be the judge.
`
I got the following after clicking Stimulus twice and selecting degrees, and clicking for the 3rd and 4th time did not change it at all:
Note: Apart from the odd scale automatically selected for the X axis, it says "IN2: phase(rad)" and 'degrees' indicated on Y axis.
So we need to keep in mind phase areas of Sigma Studio are riddled, or at least sprinkled with bugs.
This goes back to the question, "How reliable are these figures/graphs?". I guess I need to rely on my ears to be the judge.
`
Last edited:
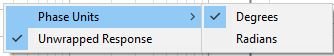
I used the Windows snipping tool. I set the delay for 5 seconds, clicked on New and then right clicked on the graph and then selected Phase options. At that point wait for the delay to time out.
Your phase graph is correct for the 1 Hz range (279 to 280 Hz). Just change it to 20 and 20000 Hz. I also noticed that the IN2 legend always says "phase(rad)". Small nit if the graph is correct.
Yes, SigmaStudio has its fair share of bugs. But it's powerful, free and has an active support forum. My favorite control is the AutoEQ. It's very powerful and is the main reason I use SigmaStudio. But it has so many quirks and bugs that I created an annotated copy of the AutoEQ Wiki to document all the problems I found and my work arounds.
Oh, the delay setting, I see. Thanks again for the tip!
The numbers, line spacing, unit on the scale; and the legend (and the title) are essential parts of a graph, and inaccuracies (and inadequate selections --like the 279-280Hz) on them degrade the graph's usability, and often make it misleading. I made a fool out of myself in the calculations I showed on my post #66 on this thread because of it.
The decreased level of confidence in general has made me question the validity of Sigma Studio graphs, and I have made it a habit to check a major change in dsp programming by measuring the amp/speakers with REW after those changes, to make sure the changes appear on the measurement as intended.
Having said that, these checks (only three occasions so far though) seem to prove the validity in general, and you are right that many of the bugs/inaccuracies are nits and I may be too japanese in terms of being a stickler of details.")
`
Is the annotated copy of the AutoEQ Wiki available somewhere online? I totally agree AutoEQ is a huge part of Sigma Studio value, and such a wiki would be precious for many.
I just wish if AutoEQ/SigmaStudio had some (even primitive) means to let us evaluate the tradeoff between frequency response vs. phase distortion.
`
The numbers, line spacing, unit on the scale; and the legend (and the title) are essential parts of a graph, and inaccuracies (and inadequate selections --like the 279-280Hz) on them degrade the graph's usability, and often make it misleading. I made a fool out of myself in the calculations I showed on my post #66 on this thread because of it.
The decreased level of confidence in general has made me question the validity of Sigma Studio graphs, and I have made it a habit to check a major change in dsp programming by measuring the amp/speakers with REW after those changes, to make sure the changes appear on the measurement as intended.
Having said that, these checks (only three occasions so far though) seem to prove the validity in general, and you are right that many of the bugs/inaccuracies are nits and I may be too japanese in terms of being a stickler of details.
`
Is the annotated copy of the AutoEQ Wiki available somewhere online? I totally agree AutoEQ is a huge part of Sigma Studio value, and such a wiki would be precious for many.
I just wish if AutoEQ/SigmaStudio had some (even primitive) means to let us evaluate the tradeoff between frequency response vs. phase distortion.
`
Last edited:
Here's the link for the Auto EQ Wiki:
Automatic Speaker EQ [Analog Devices Wiki]
I need to update my annotated version before posting.
Automatic Speaker EQ [Analog Devices Wiki]
I need to update my annotated version before posting.
Aside from the sound quality issue, the trial #67 (post on this thread) had volume control problem as well. The 16 steps lookup table resulted in the first 3 LED positions or so on the volume totally silent, and the 4th position produced a louder sound than I'd like (which can be adjusted down by changing the figures on the table).
So I changed the lookup table to 32 steps, which improved the volume issue, but still the first 1.5 positions or so were silent. Finally, I realized I needed to boost up the volume level signal from the AUX_ADC_2 to make the 1st LED position on the volume knob to produce a low level sound, by adding a Gain block immediately after the ADC (this addition required the figures on the volume lookup table to be re-adjusted).

This also necessitated a change to the dynamic bass boost lookup table on the User EQ page to 32 steps with most of the latter entries on the table set at 0 (Filter 0 = Index 0 is set to filter bypass on the filter block. Filter 5 is +10dB boost.).
I also changed the All Pass filter Q from 6.0 to 2.0 (which did result in shallower delay slope covering 3,000-6,000Hz), and hoped the sound quality to improve. Doing the comparison test to no-filter sound proved, however, this change did not improve the sound quality to my ears.
`
So I changed the lookup table to 32 steps, which improved the volume issue, but still the first 1.5 positions or so were silent. Finally, I realized I needed to boost up the volume level signal from the AUX_ADC_2 to make the 1st LED position on the volume knob to produce a low level sound, by adding a Gain block immediately after the ADC (this addition required the figures on the volume lookup table to be re-adjusted).
This also necessitated a change to the dynamic bass boost lookup table on the User EQ page to 32 steps with most of the latter entries on the table set at 0 (Filter 0 = Index 0 is set to filter bypass on the filter block. Filter 5 is +10dB boost.).
I also changed the All Pass filter Q from 6.0 to 2.0 (which did result in shallower delay slope covering 3,000-6,000Hz), and hoped the sound quality to improve. Doing the comparison test to no-filter sound proved, however, this change did not improve the sound quality to my ears.
`
Last edited:
Some of you with keen eyes may have noticed the above schematic (post #77 on this thread) is using 96kHz system sampling rate.
ADAU1701 can run 1024 instructions per sample at 48kHz, 512 instructions at 96kHz, and 256 steps at 192kHz. After doing a Link Compile Connect, the Number of instructions used indicated in compiler_output.txt file for the above project is 749, which exceeds the limit at 512 for 96kHz. Thus it should not be able to run at 96kHz. But it links, compiles, downloads no problem and DAP1002 boots and runs apparently fine with this project written on the EEPROM.
If you take a look at the following pic, you'll notice a 3e Audio No ASB project (without Log Volume) uses 514 steps when the User EQ page is removed:

This might indicate, as 514 is more than the 512 limit, there is no hope of running the ADAU1701 in DAP1002 at 96kHz in theory.
However, adding the User EQ page with one filter to the above project shows:

that it is also using 514 instruction cycles, and the same amount of data (192 bytes) and parameter (83 bytes) RAMs. This does not really make sense because one such 2ch filter should use 12-18 steps (Resource usage of any block can be checked on SigmaStudio Algorithm Resource Summary [Analog Devices Wiki]).
The reason behind the word usage in "Note: 'Estimates' are based on a 48 kHz sample rate" on compiler_output.txt according to ADI, is that some of the DSP programming could have loops that the compiler has no idea how many times the code will loop. But may be there are other reasons as well.
Apparently, there is a thing called Advanced Framework Configuration that makes it possible to monitor overrun conditions on Sigma DSP, but unfortunately this function is not available on ADAU1701. What I really need is a tool to tell me the sampling rate my 1701 is actually running at regardless of the setting.
`
ADAU1701 can run 1024 instructions per sample at 48kHz, 512 instructions at 96kHz, and 256 steps at 192kHz. After doing a Link Compile Connect, the Number of instructions used indicated in compiler_output.txt file for the above project is 749, which exceeds the limit at 512 for 96kHz. Thus it should not be able to run at 96kHz. But it links, compiles, downloads no problem and DAP1002 boots and runs apparently fine with this project written on the EEPROM.
If you take a look at the following pic, you'll notice a 3e Audio No ASB project (without Log Volume) uses 514 steps when the User EQ page is removed:
This might indicate, as 514 is more than the 512 limit, there is no hope of running the ADAU1701 in DAP1002 at 96kHz in theory.
However, adding the User EQ page with one filter to the above project shows:
that it is also using 514 instruction cycles, and the same amount of data (192 bytes) and parameter (83 bytes) RAMs. This does not really make sense because one such 2ch filter should use 12-18 steps (Resource usage of any block can be checked on SigmaStudio Algorithm Resource Summary [Analog Devices Wiki]).
The reason behind the word usage in "Note: 'Estimates' are based on a 48 kHz sample rate" on compiler_output.txt according to ADI, is that some of the DSP programming could have loops that the compiler has no idea how many times the code will loop. But may be there are other reasons as well.
Apparently, there is a thing called Advanced Framework Configuration that makes it possible to monitor overrun conditions on Sigma DSP, but unfortunately this function is not available on ADAU1701. What I really need is a tool to tell me the sampling rate my 1701 is actually running at regardless of the setting.
`
I found an indirect solution without the tool to tell me the real sampling rate.

In order for a Sigma DSP to run at 96kHz sampling rate, there are three settings on Register Window we need to change in addition to the 'fs-' setting on the dropdown list on the top line of main window.
After clicking on Hardware Configuration tab, you can get to the Register Window by clicking on "IC 2 - 170x\140x Register Control" tab at the bottom of the main pane next to Config tab.
1. Select "2x (512 Instructions)" on the upper dropdown on DSP Core panel.
2. Select "internal clock/512" on Frame Sync Freq. dropdown on Serial Output 1 panel.
3. Select "internal clock/8" on BCLK dropdown on Serial Output 1 panel.
I found if I do these selections while Sigma Studio is connected to ADAU1701/DAP1002 when it is playing music, and if the number of instruction cycles of the project truly exceeds the 512 step limit of 96kHz operation, then ADAU1701/DAP1002 stops functioning and the music stops.
(When the memory usage limit is exceeded, the compiler throws an exception at Link Compile Download, so there is no need for guesswork or work-around.)
I can attest now that the "one filter only" project in the above post with the 'Estimate' of 514 steps indicated on compiler_output.txt accepts all three selections above, and it compiles and runs (and reboots) fine at 96kHz. This likely means the true total instruction cycles used in the project is 512 steps per sample or less.
As 'growing' the only filter to 2 filters makes the three selections rejected, it must be pretty close to the 512 cycles limit, but ADAU1701 does not heat up or shows any thermal problem to the touch of my finger.
When the only peaking filter is set to the worst resonant frequency of my room with -3dB boost, the sweet sound quality of this project exceeded the sound quality of the no-filter project that is also set at 96kHz. Yay!
`
I was happy to have achieved running my ADAU1701/DAP1002 at 96kHz and thought I will be running this configuration for a long time. But I noticed a tenor sax solo part in a very familiar track sounded funny. It's tone was not right.
So I compared the sound of the new "96kHz one filter" project to no-filter project again, this time not the new 96kHz no-filter, but against the old 48kHz no-filter project. And, to my surprise, the old 48kHz .dspproj without the User EQ page sounded clearly better!
This might mean the load level on the DSP, which is likely near 100% on the 96kHz one filter project in terms of number of instruction cycles used on each sample, has something to do with the sound quality. I thought I was onto a long haul in dealing with such a powerful DSP, but...sigh...I guess I was right...
`
- Home
- Amplifiers
- Class D
- 3e Audio TPA3250D2 (SY-DAP1002) Mods & DSP Tuning