Just banged out some quick Matlab/Octave code for calculating/analyzing output filters.
TI suggests 10uH/680nF for the output filter on the TPA. This gives a corner frequency of 61033Hz.
Into a 4 ohm resistive load, Q = 0.522, amplitude response is (freq/dB pairs)
10000 16000 18000 20000 22000 400000
-0.19418 -0.49194 -0.61973 -0.76113 -0.91564 -32.82832
Into an 8 ohm resistive load, Q=1.043, amplitude response is:
10000 16000 18000 20000 22000 400000
0.12466 0.31311 0.39267 0.47952 0.57277 -32.55150
Looks like it works for both, but isn't optimized for either. Dips at 4 ohms, peaks at 8 ohms. TI seems to think -32dB @ 400KHz (lowest AMx setting) is OK so let's try to maintain that attenuation for EMI reasons.
Optimizing for 4 ohms...
First lets set the Q to 0.707 at 4 ohms while keeping the 10uH inductor. This gives a Butterworth response with no peaking. Into 4 ohms, Q=0.707 when C=1.25uF. Nearest C is 1.2uF, using that cap gives Fc=45944Hz, Q=0.692, and the following amplitude response:
10000 16000 18000 20000 22000 400000
-0.026809 -0.106454 -0.155068 -0.218920 -0.300658 -37.50840
Lets try a 1.5uF cap for fun. Q=0.7746, Fc=41094Hz, and the amplitude response is this. There's a very slight in-band peak.
10000 16000 18000 20000 22000
0.071075 0.121330 0.119509 0.100384 0.058547 -39.45872
In both cases we've got a better in-band frequency response than stock, and more attenuation at the 400+ KHz switching frequency... I don't see any reason not use 1.2uF/1.5uF instead of 0.68uF into 4 ohm speakers.
For the sake of completeness, 1uF gives Q=0.63246, Fc=50329 and:
10000 16000 18000 20000 22000 400000
-0.091524 -0.256116 -0.335508 -0.429272 -0.538647 -36.044916
Next lets optimize for 8 ohms...
Now lets set the Q to 0.707 at 8 ohms with the 10uH inductor still. This gives C=0.312uF, nearest C is 0.33uF, using that cap gives Fc=87612Hz, Q=0.727 and the following response:
10000 16000 18000 20000 22000 400000
5.2669e-003 1.0544e-002 1.1721e-002 1.2227e-002 1.1793e-002 -2.6368e+001
Or a stupidly flat passband, but -26dB rolloff at 400KHz.
Going up a C to 0.39uF gives Q=0.78994, F=80591 and the following response. Better attenuation (slightly) at the switching frequency but more peaking. I don't like it.
10000 16000 18000 20000 22000 400000
0.025621 0.061722 0.075956 0.090770 0.105785 -27.767517
So let's switch to a 15uH inductor for 8 ohms and re-run some numbers...
C=0.47uF gives Q=0.70805, Fc=59941 and the following response:
10000 16000 18000 20000 22000 400000
-2.7204e-003 -2.0354e-002 -3.3106e-002 -5.0955e-002 -7.5044e-002 -3.2975e+001
.. So a very slight rolloff (-0.075dB @ 22K), and we're back at -32dB attenuation at 400KHz. 15uH definitely works better than 10uH here.
Going up to C=0.56uF gives Q=0.77287, Fc=54914 and a slight bit of peaking:
10000 16000 18000 20000 22000 400000
0.042365 0.089776 0.103149 0.112777 0.116844 -34.469975
In the opposite direction, C=0.39uF gives Q=0.64498, Fc=65802 and:
10000 16000 18000 20000 22000 400000
-0.042612 -0.117278 -0.152834 -0.194657 -0.243363 -31.403063
Moving up to 22uH with our 8 ohm load..
C=0.68uF gives Q=0.70324, Fc=41149 and some droop:
10000 16000 18000 20000 22000 400000
-0.020757 -0.112296 -0.173828 -0.257235 -0.366349 -39.509726
C=0.82uF gives Q=0.77225, Fc=37472 and a nice inband peak, with tons of stopband attenuation. This is really nice.
10000 16000 18000 20000 22000 400000
0.078636 0.112983 0.093620 0.047638 -0.032111 -41.122326
Overall it looks like 15uH/0.47uF or 22uH/0.82uF is the way to go for 8 ohms.
Now someone asked me to make a Wiener card do a 16 ohm load. Lets try that. I'll assume at the very least we'll need a 22uH inductor...
With C=0.15uF, Q=0.66058 and Fc=87612
10000 16000 18000 20000 22000 400000
-0.017205 -0.046823 -0.060778 -0.077114 -0.096068 -26.450067
With C=0.18uF, Q=0.72363, Fc=79978
10000 16000 18000 20000 22000 400000
5.0710e-003 8.7439e-003 8.7256e-003 7.5413e-003 4.8043e-003 -2.7955e+001
With C=0.22uF, Q=0.8 and Fc=72343. Still a half decent passband.
10000 16000 18000 20000 22000 400000
0.034859 0.083344 0.102176 0.121535 0.140832 -29.648615
C=0.27uF, Q=0.88626, Fc=65302. Getting kinda peaky now
10000 16000 18000 20000 22000 400000
0.072234 0.177427 0.220261 0.265861 0.313372 -31.403510
And trying the 33uH inductor with our 16 ohm load:
C=0.22uF, Q=0.65320, F=59068
10000 16000 18000 20000 22000 400000
-0.046110 -0.130925 -0.172609 -0.222439 -0.281354 -33.262809
C=0.27uF, Q=0.72363, F=53319
10000 16000 18000 20000 22000 400000
8.4259e-003 8.9591e-005 -1.1710e-002 -3.0703e-002 -5.8730e-002 -3.5002e+001
C=0.33uF, Q=0.80000, F=48229
10000 16000 18000 20000 22000 400000
0.074291 0.159401 0.184252 0.202982 0.212434 -36.723365
... maintaining EMI performance, looks like 33uH wins here.
Last edited:
I do not doubt these calculations give optimal filters theoretically.
One assumption of these calculations is the speaker having constant impedance over the hole frequency band. This may not be true at higher frequencies, specially when using single wideband speakers. And it is certainly not true at the resonant frequency of the filter, so some snubbering for damping could be essential.
All in all I want to say that the TI application might be a 4~8 Ohm compromise, but it is not that bad in practical terms.
I don't disagree that a speaker can be a more complex load than a resistor, and can affect the filter's performance... knowing that information you can design a better filter I'd imagine. The code I threw together to do this can handle complex load impedance, got any candidate speaker electrical models I can experiment with to see how much the variation ends up being?
Someone asked me about 6 ohm loading in the wiener GB thread, here's the calculations for that:
For a 6 ohm load, C=0.68uF, L=10uH:
Q=0.78230, Fc=61033, response:
10000 16000 18000 20000 22000 400000
0.039724 0.089649 0.106704 0.122320 0.135303 -32.624980
For a 6 ohm load, C=0.56uF, L=10uH:
Q=0.70993, Fc=67255, response:
10000 16000 18000 20000 22000 400000
-5.9859e-004 -9.9980e-003 -1.7310e-002 -2.7777e-002 -4.2143e-002 -3.0975e+001
6 ohm load, C=0.82uF, L=15uH:
Q=0.70143, Fc=45380, response:
10000 16000 18000 20000 22000 400000
-0.017065 -0.083853 -0.127820 -0.187185 -0.264837 -37.810233
6 ohm load, C=1uF, L=15uH:
Q=0.77460, Fc=41094, response:
10000 16000 18000 20000 22000 400000
0.071075 0.121330 0.119509 0.100384 0.058547 -39.516599
... got any candidate speaker electrical models I can experiment with to see how much the variation ends up being?
Sure. How about this speaker?
")
http://www.creativesound.ca/pdf/A10AP.pdf
Actually, what about two of those speakers, in parallel?
How much is a Butter worth?
post yer model schematics, parasitics , and any other assumptions used.
I couldn't find hardly any info on the inductors DS, losses vs Freq or SRF.
any consideration on 3rd order elliptical w/1st stop band notch at Fsample
edit> pass band ripple shouldn't be a killer on real speaker systems
consult 'Handbook of Filter Synthesis A.I.Zverev 1967-600'
Last edited:
Here's a leaned out version of what I'm using, with plotting/filter calculation/nearest part hunting/etc yanked out.
zload below can be pretty easily expanded to a more complex load.
rload = 2; % half of actual load in BTL
c = 1.5e-6;
l = 10e-6;
rl = 9e-3;
fplot = 50000;
%f = linspace(fplot/1000,fplot,1000);
f = [10000 16000 18000 20000 22000 400000];
% calc filter characteristics
wo = 1./sqrt(l.*c);
q = wo*rload*c; % q doesn't include Rload (figure out later)
fo = wo/(2*pi);
zload = rload;
zc = -j./(2*pi*f*c);
zl = j*2*pi*f*l + rl;
zrc = 1./(1./zc + 1./zload);
resp = zrc ./ (zrc + zl);
logresp = 20*log10(abs(resp));
disp(logresp);
Last edited:
So here's the latest bit of code I've been using for evaluating filters with speakers attached. I've got a more elaborate copy done up which does the full electrical model of a speaker.
One big conclusion I'm drawing from this: USE A ZOBEL. Try running this code with the "rz" value changed from 8.2 to 8.2e6, which takes the zobel out of circuit for all purposes. With 8.2, voltage gain of the filter never goes above 1. With 8.2e6, there's a +20dB spike around 71KHz - if your amp puts this frequency out for whatever reason, the output filter will magnify the voltage and possibly even burn up the output caps on the amp.
I'm using Octave, this should work in Matlab also.
% TPA response plotter
% march 2015, gmarsh
% output filter (1D14A-150M)
rl = 16e-3;
l = 15e-6;
c = 0.47e-6;
% speaker (Alpair 10M)
% motional part of electrical model left out here, as it's largely insignificant here
re = 7.2;
le = 71.379e-6;
% speaker zobel network
rz = 8.2;
cz = 1e-6;
% == boring math below ==
% make plotting vector
% replace 0hz with 1Hz to avoid divide by zero
fplot = 100000;
f = linspace(fplot/1000,fplot,1000);
w = f*2*pi;
% calculate speaker impedance
zspeaker = re + j*w*le;
zzobel = rz + 1./(j*w*cz);
zload = 1./(1./zspeaker + 1./zzobel);
% divide speaker load by two (since this is a BTL amplifier)
zload = zload ./ 2;
zc = 1./(j*w*c);
zshunt = 1./(1./zload + 1./zc);
zl = rl + j*w*l;
response = zshunt./(zshunt + zl);
% plot result
subplot(2,1,1);
semilogx(f,20*log10(abs(response)));
ylabel('dB');
title('Electrical response');
grid on;
subplot(2,1,2);
semilogx(f,abs(zload*2));
ylabel('ohms');
title('Amp load');
grid on;


Ti has a PDF called sloa119B which is about class D filter design. For 8ohm it suggests 15uH with 1.5uF caps, it suggests this gives Q=1.26. And THD+N OF 0.096.
For 22uH it mentions 0.68uF caps with Q=o.7 THD+N of 0.75, and 33uH with 1uF caps at Q=O.7 with THD+N = 0.05.
THESE FIGURES WERE ESTABLISHED ON THE tpa3106d1 EVM though.
For 22uH it mentions 0.68uF caps with Q=o.7 THD+N of 0.75, and 33uH with 1uF caps at Q=O.7 with THD+N = 0.05.
THESE FIGURES WERE ESTABLISHED ON THE tpa3106d1 EVM though.
One big conclusion I'm drawing from this: USE A ZOBEL. Try running this code with the "rz" value changed from 8.2 to 8.2e6, which takes the zobel out of circuit for all purposes. With 8.2, voltage gain of the filter never goes above 1. With 8.2e6, there's a +20dB spike around 71KHz - if your amp puts this frequency out for whatever reason, the output filter will magnify the voltage and possibly even burn up the output caps on the amp.
Obviously +20dB is bad... Is there any "acceptable" level of increase?
I assume the goal is generally to be very close to zero for the audio band. And clearly we don't want to amplify frequencies outside the audio band by any significant amount. But what is "significant"?
I ask because I am playing with your code and looking to put a warning if such a threshold is crossed. I'm (trying to) somewhat automate this into batch form, rather than continuously plugging in numbers and graphing. So I can programmatically set thresholds for within the audio band, and outside the audio band.
Thanks!
Another question, using as a segue a quote from doctormord in the big tpa3116 thread:
Would it be possible to better refine these models if the speaker impedance was given as a series, rather than a fixed number? The speakers I'm looking at (and I assume most speakers in general) don't have a flat impedance, but rather a curve. And again, at least the ones I'm looking at publish that curve. We'd have to read the graph to get all the points (unless the manufacturer was willing to provide the actual plot data). But I suspect just inputting a handful of key points, and using a basic interpolation to fill in the gaps would be leaps and bounds above using a single fixed impedance. (And we'd have to guess or ask the manufacturer for impedance data above 22kHz, since that's rarely shown.)
Assuming you follow my train of thought, then your "re" variable becomes a series just like "f". So I think this is the only line that would be affected:
And it might "just work" without any tweaking?
Apologies if my questions/ideas are completely off-base or nonsense. Go easy on me, this isn't my domain of expertise!
From the simulations i did in LTspice with the inductor-models i have all those calculations are only valid for pure resistive loads. ("Real" speakers alters the Q alot even if just the additional inductance is taken into account)
Would it be possible to better refine these models if the speaker impedance was given as a series, rather than a fixed number? The speakers I'm looking at (and I assume most speakers in general) don't have a flat impedance, but rather a curve. And again, at least the ones I'm looking at publish that curve. We'd have to read the graph to get all the points (unless the manufacturer was willing to provide the actual plot data). But I suspect just inputting a handful of key points, and using a basic interpolation to fill in the gaps would be leaps and bounds above using a single fixed impedance. (And we'd have to guess or ask the manufacturer for impedance data above 22kHz, since that's rarely shown.)
Assuming you follow my train of thought, then your "re" variable becomes a series just like "f". So I think this is the only line that would be affected:
Code:
zspeaker = re + j*w*le;Apologies if my questions/ideas are completely off-base or nonsense. Go easy on me, this isn't my domain of expertise!
If the speaker plot is a simple rising curve, I'd make the assumption that the impedance rise is mainly due to j*w*le. You should be able to derive the Le value from the impedance curve.Another question, using as a segue a quote from doctormord in the big tpa3116 thread:
Would it be possible to better refine these models if the speaker impedance was given as a series, rather than a fixed number? The speakers I'm looking at (and I assume most speakers in general) don't have a flat impedance, but rather a curve. And again, at least the ones I'm looking at publish that curve. We'd have to read the graph to get all the points (unless the manufacturer was willing to provide the actual plot data). But I suspect just inputting a handful of key points, and using a basic interpolation to fill in the gaps would be leaps and bounds above using a single fixed impedance. (And we'd have to guess or ask the manufacturer for impedance data above 22kHz, since that's rarely shown.)
Assuming you follow my train of thought, then your "re" variable becomes a series just like "f". So I think this is the only line that would be affected:
And it might "just work" without any tweaking?Code:zspeaker = re + j*w*le;
Apologies if my questions/ideas are completely off-base or nonsense. Go easy on me, this isn't my domain of expertise!
Start with: Z = sqrt( re^2 + (2*pi*f*le)^2 )
Rearrange that to: le = sqrt(Z^2 - re^2) / (2*pi*f)
Grab a bunch of impedance/frequency points off the plot, and calculate Le for each of them using the 2nd formula. Hopefully they'll average out nicely to a Le value that you can punch into the matlab code.
Ti has a PDF called sloa119B which is about class D filter design. For 8ohm it suggests 15uH with 1.5uF caps, it suggests this gives Q=1.26. And THD+N OF 0.096.
For 22uH it mentions 0.68uF caps with Q=o.7 THD+N of 0.75, and 33uH with 1uF caps at Q=O.7 with THD+N = 0.05.
THESE FIGURES WERE ESTABLISHED ON THE tpa3106d1 EVM though.
Yup. I was searching around on my computer and found it. Hope it is useful for someone. I am no expert in class D amp but I found this article quite readable.
Attachments
I would put it that way: As long as series inductance of speaker coils is bigger than the sum of series inductance of output filter, you cannot expect significant damping of filter resonance peak by connecting the speaker. This is a fundamental problem of all class-d-amps with pre-filter loop feedback.Yup. I was searching around on my computer and found it. Hope it is useful for someone. I am no expert in class D amp but I found this article quite readable.
Lab tests with resistors do not reflect reality at higher frequencies imho.
my 2c
If the speaker plot is a simple rising curve, I'd make the assumption that the impedance rise is mainly due to j*w*le. You should be able to derive the Le value from the impedance curve.
Start with: Z = sqrt( re^2 + (2*pi*f*le)^2 )
Rearrange that to: le = sqrt(Z^2 - re^2) / (2*pi*f)
Grab a bunch of impedance/frequency points off the plot, and calculate Le for each of them using the 2nd formula. Hopefully they'll average out nicely to a Le value that you can punch into the matlab code.
Not sure if this is in any way meaningful or useful to anyone... but it was fun to play with the code and generate some graphs.
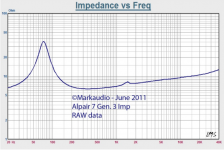
This is all for the Mark Audio Alpair 7.3, which is what I'm using on my desktop. Here's a link to the datasheet. Here's the parameters for convenience, along with the published freqency versus impedance graph.
Code:
REVC ............. 5.4 Ohm
Fo ............... 70.90 Hz
Sd ............... 5.02 K mm/2
Vas .............. 4.58 Ltrs
Cms .............. 1.27 uM/N
Mmd .............. 3.74 g
Mms .............. 3.95 g
BL ............... 3.83 T*M
Qms .............. 3.07
Qes .............. 0.65
Qts .............. 0.54
Levc ............. 21.30 uH
No ............... 0.24%
Spl .............. 85.80 dB (with rear cover)
Spl .............. 85.20 dB (rear cover removed)
Pwr .............. 20w Nom.
X max ............ 4.2 mm 1 way
Coil Dia ......... 20-mm
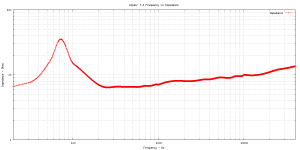
Main tolerance ... +/- 1.5 Hz on mean FoSo I created two graphs myself: one is a re-creation of the frequency versus impedance graph. This was done by the method I suggested above: picking points off the published graph, then using a canned interpolation function to fill in the blanks.
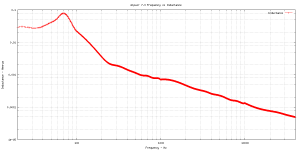
Next step was to use gmarsh's formula for le, calculating it for every f and Z point from the interpolated freq vs impedance data.
Attachments
Some cheap eBay TPA3118 amp boards just sparked my interest in Class D. While I'm still waiting for the modules to arrive, I read up some threads here on modding them, especially regarding the output filter. Being a fan of LTSpice, I fired up the simulator and played a bit with different coil/cap-values for different output impedances.
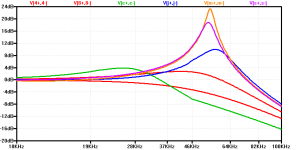
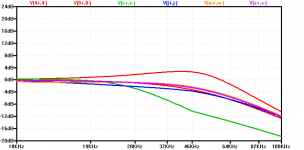
The configuration on the boards seems to be 10uH and 1uF ceramic in a common-mode configuration (parallel bridge, PBTL). Those values simulate well with a resistive 4R load, and some slight 3dB peaking around 40kHz with a resistive 8R load. They're the two red traces in the graph below.
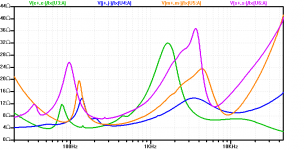
I wanted to know what the response would look like with a more realistic speaker load though, so I found a way to model my speakers in LTSpice. Since I have multiple different speakers around, I measured them all up and threw them in the sim. Here's the result:

The speaker with the overall lowest impedance (green trace) should work just fine, while all the other speakers with somewhat higher impedances show some heavy peaking, up to almost 24dB!
I second that. This is what I figured out to be pretty effecive (in simulation, at least!), before I stumbled upon this thread.
This is what the results look like with an added zobel of 22uF and 4R7 (same scale for easy comparison):

Now the three speakers that showed the highest peaking almost exactly line up with the resistive 4R graph. The green graph looks almost a little overcompensated already, but the response at 20kHz is not much different from the others. The cutoff frequency is a little lower though and thus should lead to a somewhat higher attenuation of the switching frequency (which is a good thing, so another plus for the zobel).
Anybody tried this in the real world? I've never seen a schematic with a zobel capacitor in the tens of microfarads yet, only things below half a microfarad. They're just not that effective in the simulator...
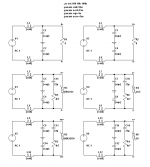
Here's the simulated circuit:

The different impedance plots of my speakers:

And finally the simulation file for your own experiments.
The configuration on the boards seems to be 10uH and 1uF ceramic in a common-mode configuration (parallel bridge, PBTL). Those values simulate well with a resistive 4R load, and some slight 3dB peaking around 40kHz with a resistive 8R load. They're the two red traces in the graph below.
I wanted to know what the response would look like with a more realistic speaker load though, so I found a way to model my speakers in LTSpice. Since I have multiple different speakers around, I measured them all up and threw them in the sim. Here's the result:
The speaker with the overall lowest impedance (green trace) should work just fine, while all the other speakers with somewhat higher impedances show some heavy peaking, up to almost 24dB!
One big conclusion I'm drawing from this: USE A ZOBEL.
I second that. This is what I figured out to be pretty effecive (in simulation, at least!), before I stumbled upon this thread.
This is what the results look like with an added zobel of 22uF and 4R7 (same scale for easy comparison):
Now the three speakers that showed the highest peaking almost exactly line up with the resistive 4R graph. The green graph looks almost a little overcompensated already, but the response at 20kHz is not much different from the others. The cutoff frequency is a little lower though and thus should lead to a somewhat higher attenuation of the switching frequency (which is a good thing, so another plus for the zobel).
Anybody tried this in the real world? I've never seen a schematic with a zobel capacitor in the tens of microfarads yet, only things below half a microfarad. They're just not that effective in the simulator...
Here's the simulated circuit:
The different impedance plots of my speakers:
And finally the simulation file for your own experiments.
Attachments
- Status
- This old topic is closed. If you want to reopen this topic, contact a moderator using the "Report Post" button.
- Home
- Amplifiers
- Class D
- Some rambling calculation on TPA3116/8 filters.