The layout is a little bit different and the PSU is now an unregulated one. Other than that the circuit is the same, except that I now used 1n instead of 1n5 at the input lpf.
The wire loops actually are the legs of the bridge rectifier underneath the perfboard. I simply bent them over once, so they don't just stick up and might get shorted while I squeeze everything else in there.
The wire loops actually are the legs of the bridge rectifier underneath the perfboard. I simply bent them over once, so they don't just stick up and might get shorted while I squeeze everything else in there.
I was able to borrow me a simple DDS signal generator for some frequencies above what my soundcard can measure. With the oscilloscope on the output of the amplifier, I fed the input with 0.1Vpp and stepped through in 100kHz increments up to 1MHz. The highest output level I could measure was around 500kHz, for an amplifier gain of roughly 21dB, compared to the targeted 6dB up to 20kHz. On the 'scope that looks like quite a lot  .
.
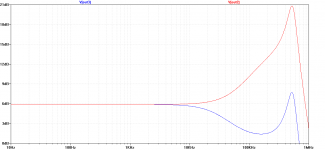
I was able to bring the peak down considerably by using 4n7 instead of 1n in the input LPF. This brings down the gain at 20kHz by about 1dB too though, but the amp remains stable. I have yet to re-check the THD values.
The graph shows a rough approximation of the frequency responses with 1n (red) and 4n7 (blue) input filter cap, which I arrived at by tweaking the LTspice opamp model to resemble the measured peak.
.I was able to bring the peak down considerably by using 4n7 instead of 1n in the input LPF. This brings down the gain at 20kHz by about 1dB too though, but the amp remains stable. I have yet to re-check the THD values.
The graph shows a rough approximation of the frequency responses with 1n (red) and 4n7 (blue) input filter cap, which I arrived at by tweaking the LTspice opamp model to resemble the measured peak.
Attachments
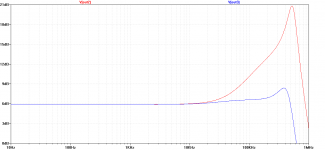
Adding another 4n7 in parallel with the 4n7 which is already there in series with the 47R on the inverting input makes the frequency response look a lot nicer. The peak is only slight now and moved a little down to around 330kHz. The tweaked model is not exactly spot-on here.
I'll see if I can find enough capacitors in the parts bin and then add them to the stereo version for a comparative THD measurement.
I'll see if I can find enough capacitors in the parts bin and then add them to the stereo version for a comparative THD measurement.
Attachments
That's fishy: the 1kHz THD should only be very marginally impacted, and the variation should be gradual.THD at 1kHz skyrocketed to over 0.4%
Shifting from 0.00x % to 0.4% with just a small change means you are measuring something else or wrong. Double-check your connections, solders, etc, listen to the result, extract the THD residue and you will find something abnormal.
Revert to the initial situation and remeasure the THD: you might find it has also become 0.4%
Reverting to the initial situation is a PITA with that tightly stuffed and plated-through construction that I created there... I'll try, but not today.
I did the capacitor swap to both channels at once. They were both fine before, and now they're both bad. Unfortunately I blew the TDA on the experimental first board - maybe I'll fix that one first.
The THD values actually decrease rapidly when I decrease the input level, reaching 0.003% again when I'm around 12dB down. It is not a total failure, but the amp doesn't manage +6dBV into 8R with low distortion anymore.
LV, you're right again... It's another fish! Not sure what I f**ked up this time, but I'll investigate.
Fixed the blown TDA and measured THD with the new modifications running on the lab supply. The measured values are about as good as before, with 0.004% at 1kHz and 0.022% at 10kHz (the 10kHz values were a '0' better with the unregulated supply).
The only obvious difference is that I used two 4n7 WIMA foils in parallel on the now running amp, and 10n ceramics in the defunct amps. I doubt that that's what's causing the fault though.
Capacitor distortion it is . Now I feel stupid .
According to SPICE the cap only sees the full input voltage, which was 1V RMS in this case. Never had I thought that that would be enough to cause such a dramatic increase in distortion!
Takeaway message #2: Be careful with any ceramics in the signal path, as long as they are not C0G/NP0 (probably...).
(Takeaway message #1: Be careful with any wirewound resistors in the signal path)
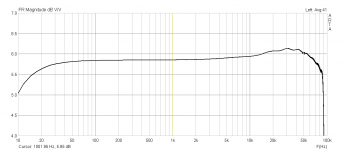
Now everything looks nice. Frequency response is reasonably flat and starts to slope downwards around 30kHz - no nasty ultrasonic boost anymore. THD is 0.0011% for 1kHz and 0.0081% for 10kHz now (measured at 192kS), which is quite a bit better than the datasheet circuit. With 44,1kS sample rate the 1kHz THD even shows as an impeccable 0.00049%.
Thank you again Elvee for pointing me towards the fish! I would have probably tossed the whole thing without giving it another chance....
anti,
your added 100pF seem to do nothing in real life. The falstad sim looks pretty flat, but it still does when you add the zobel into the mix:
$ 0 5.0E-6 5 20 5.0 50
% 4 7405355.25601205
g 288 304 288 352 0
w 384 256 384 304 0
a 384 240 528 240 1 15.0 -15.0 4000000.0
w 528 240 528 304 0
r 384 304 528 304 0 1000.0
r 288 304 384 304 0 1000.0
O 528 240 592 240 0
170 384 160 384 112 2 20.0 400000.0 5.0 0.1
c 288 304 288 256 0 2.2E-9 0.0
r 288 256 384 256 0 47.0
r 384 160 384 224 0 1000.0
c 384 224 240 224 0 1.0E-9 0.0
g 240 224 240 352 0
c 384 224 384 256 0 1.0E-10 0.0
r 384 160 240 160 0 10000.0
w 240 160 240 224 0
w 528 304 528 336 0
r 528 336 384 336 0 1.0
c 384 336 288 336 0 2.1999999999999998E-7 0.0
r 576 240 576 352 0 8.0
g 576 336 576 352 0
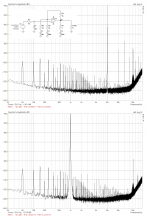
The LTspice simulation looks a lot different and happens to coincide pretty much with what I measured on my prototype.
. Now I feel stupid .According to SPICE the cap only sees the full input voltage, which was 1V RMS in this case. Never had I thought that that would be enough to cause such a dramatic increase in distortion!
Takeaway message #2: Be careful with any ceramics in the signal path, as long as they are not C0G/NP0 (probably...).
(Takeaway message #1: Be careful with any wirewound resistors in the signal path)
Now everything looks nice. Frequency response is reasonably flat and starts to slope downwards around 30kHz - no nasty ultrasonic boost anymore. THD is 0.0011% for 1kHz and 0.0081% for 10kHz now (measured at 192kS), which is quite a bit better than the datasheet circuit. With 44,1kS sample rate the 1kHz THD even shows as an impeccable 0.00049%
.Thank you again Elvee for pointing me towards the fish! I would have probably tossed the whole thing without giving it another chance....
anti,
your added 100pF seem to do nothing in real life. The falstad sim looks pretty flat, but it still does when you add the zobel into the mix:
$ 0 5.0E-6 5 20 5.0 50
% 4 7405355.25601205
g 288 304 288 352 0
w 384 256 384 304 0
a 384 240 528 240 1 15.0 -15.0 4000000.0
w 528 240 528 304 0
r 384 304 528 304 0 1000.0
r 288 304 384 304 0 1000.0
O 528 240 592 240 0
170 384 160 384 112 2 20.0 400000.0 5.0 0.1
c 288 304 288 256 0 2.2E-9 0.0
r 288 256 384 256 0 47.0
r 384 160 384 224 0 1000.0
c 384 224 240 224 0 1.0E-9 0.0
g 240 224 240 352 0
c 384 224 384 256 0 1.0E-10 0.0
r 384 160 240 160 0 10000.0
w 240 160 240 224 0
w 528 304 528 336 0
r 528 336 384 336 0 1.0
c 384 336 288 336 0 2.1999999999999998E-7 0.0
r 576 240 576 352 0 8.0
g 576 336 576 352 0
The LTspice simulation looks a lot different and happens to coincide pretty much with what I measured on my prototype.
Attachments
They're X7R, which I thought were not half as bad
DC-AC Bias Dependence of MLCC Capacitors | doEEEt.com
Fig 6-10
- Status
- This old topic is closed. If you want to reopen this topic, contact a moderator using the "Report Post" button.
- Home
- Amplifiers
- Chip Amps
- Fun with a cheap TDA2030A at only 6dB gain