At last I've managed to reproducing Jackinnj's image.
First step was to reduce the Q significantly, while still keeping the phase going from +90 to -90degrees.
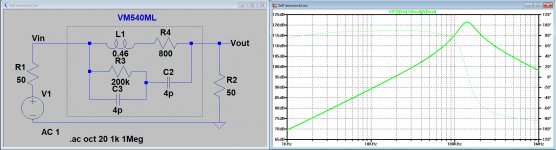
This was possible by splitting the Cap in two pieces and by adding a damping resistor.
See the LTspice model below and the sim |Z|=50*(Vin-Vout)/Vout.
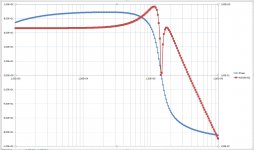
From this I extracted Re and Im.
Treating the Imaginary values as being produced by a coil, I divided its absolute values by 2*Pi.
And voila, there it is, at the end quite a simple minimum phase model with just one SFR (self resonating frequency).
Hans
First step was to reduce the Q significantly, while still keeping the phase going from +90 to -90degrees.
This was possible by splitting the Cap in two pieces and by adding a damping resistor.
See the LTspice model below and the sim |Z|=50*(Vin-Vout)/Vout.
From this I extracted Re and Im.
Treating the Imaginary values as being produced by a coil, I divided its absolute values by 2*Pi.
And voila, there it is, at the end quite a simple minimum phase model with just one SFR (self resonating frequency).
Hans
Attachments
Well done, Hans. Although the system is minimum phase, phase plot and |Imag| don't match because that's not the system.At last I've managed to reproducing Jackinnj's image.
First step was to reduce the Q significantly, while still keeping the phase going from +90 to -90degrees.
This was possible by splitting the Cap in two pieces and by adding a damping resistor.
See the LTspice model below and the sim |Z|=50*(Vin-Vout)/Vout.
From this I extracted Re and Im.
Treating the Imaginary values as being produced by a coil, I divided its absolute values by 2*Pi.
And voila, there it is, at the end quite a simple minimum phase model with just one SFR (self resonating frequency).
Hans
At small levels the challenge is to extract accurate phase info in this method. Also to know with confidence that |Imag| at 10kHz is inductive, which in this system it probably is.
Another method that might be easier at small signals is to examine |Real| at 10kHz. Thesis is that a loss mechanism would be involved in any apparent L reduction, which would show up in |Real|.
A philosophical thought: for a given flux change, does generator output follow |Imag|? I think it does.
LD
Last edited:
Probably my latest model comes closer to the system.Well done, Hans. Although the system is minimum phase, phase plot and |Imag| don't match because that's not the system.
That's how it seems to be.Also to know with confidence that |Imag| at 10kHz is inductive, which in this system it probably is.
Could it be that you mean |Z| instead of |Real|?Another method that might be easier at small signals is to examine |Real| at 10kHz. Thesis is that a loss mechanism would be involved in any apparent L reduction, which would show up in |Real|.
Zcart=Rload*(Vin-Vout)/(Vout).
Up to 30Khz L calculated from |Z| by dividing it by 2Pi*Freq gives almost the same outcome as when calculated from the true Imaginary.
At 10Khz they are within 1% in my model.
So do I, but at 10Khz also |Z|.A philosophical thought: for a given flux change, does generator output follow |Imag|? I think it does.
Hans
At small levels the challenge is to extract accurate phase info in this method. Also to know with confidence that |Imag| at 10kHz is inductive, which in this system it probably is.
That was my original point, the network analyzer is measuring transmission loss the rest is maths. If you look at that, due to the loss because of the impedance levels, the signal at channel A is VERY small. At a ref level of -40dBm the signal level at A gets below -80dBm and the instrument specs don't support an accurate phase measurement at that level. The de-Qing in making the model fit probably lumps all loss mechanisms such as eddy current. If a proper sensitivity analysis was done using the specs of the instrument I would suspect that the extracted values have fairly wide error bars.
BTW your notation is confusing, |Imag|, is redundant unless mag is magnetic? In either case the magnitude alone is neither inductive nor capacitive you need the phase (imaginary part).
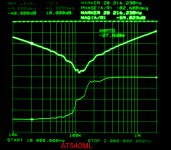
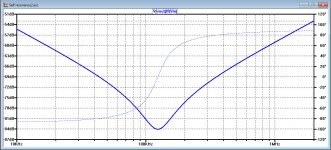
It would help even more to know the Magnitude of the Y axis for |Z|.Is this helpful? Screenshot from HP3577, not Bode 100 -- -27dBm with 1Hz bandwidth, 16 averages and a long settling time, Z in of channels A and R 50R:
Hans
Is this helpful? Screenshot from HP3577, not Bode 100 -- -27dBm with 1Hz bandwidth, 16 averages and a long settling time, Z in of channels A and R 50R:
Thanks, those are the levels I expected. Since you averaged I assume the lumpy phase at resonance is part of the instrument residual? BTW the Bode 100 supports Python so you have available some powerful (free) model fitting tools.
Last edited:
It would help even more to know the Magnitude of the Y axis for |Z|.
There is no Z on this plot, it's the magnitude of A/R which enters and leaves resonance at 20dB/decade inductive in capacitive out. See post #361 at -27dBm the plots agree (without the damped Q). I can try to add that and see what I get.
Last edited:
Hi,
in addition to the diagrams in #237 ....
Linn K18, terminated with 47k||470pF

Linn K18, terminated with 47k||235pF

Linn K18, terminated with 39k||235pF

Linn K18, terminated with 68k||235pF

The change in peak frequency and peak amplitude are obvious.
jauu
Calvn
in addition to the diagrams in #237 ....
Linn K18, terminated with 47k||470pF
Linn K18, terminated with 47k||235pF
Linn K18, terminated with 39k||235pF
Linn K18, terminated with 68k||235pF
The change in peak frequency and peak amplitude are obvious.
jauu
Calvn
Last edited:
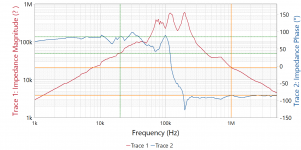
Also on the Bode 100, left y-axis is magnitude of impedance, right y-axis phase. Anyone who wants can get the raw data (real and imaginary) by sending a PM. (I did a calibration before this run.)
Jack thanks for helping out, where did the relatively smooth plot you showed at the beginning come from?
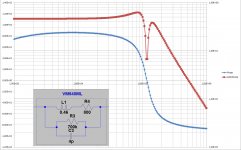
I projected my LTspice smooth images on your wobbly Analyzer A/R plot,thereby perfectly matching your phase and A/R figure and came to almost exactly the same results as before.Also on the Bode 100, left y-axis is magnitude of impedance, right y-axis phase. Anyone who wants can get the raw data (real and imaginary) by sending a PM. (I did a calibration before this run.)
460mH+800 Ohm
3.6pF//800 Kohm
Hans
Attachments
Then the plots of inductance versus level jackinnj posted are suspect IMO.That was my original point, the network analyzer is measuring transmission loss the rest is maths. If you look at that, due to the loss because of the impedance levels, the signal at channel A is VERY small. At a ref level of -40dBm the signal level at A gets below -80dBm and the instrument specs don't support an accurate phase measurement at that level. The de-Qing in making the model fit probably lumps all loss mechanisms such as eddy current. If a proper sensitivity analysis was done using the specs of the instrument I would suspect that the extracted values have fairly wide error bars.
What's more the excitation level that was applied to the coil is orders of magnitude bigger than reported, on the face of it. And that's what we're interested in alongside pulling phase info from the noise soup.
I did say this is an instrumentation job, and I don't think we're there yet though making progess for sure.
Well that was born because the magnitude of the imaginary part of impedance, ie ignoring sign, is what I understand is indirectly being reported on jackinnj's plots. It sort of works.BTW your notation is confusing, |Imag|, is redundant unless mag is magnetic? In either case the magnitude alone is neither inductive nor capacitive you need the phase (imaginary part).
The philosophical point is that only the +ve imaginary part of coil 'impedance' can generate. So |Imag| might be what we're looking for.
LD
Last edited:
The philosophical point is that only the +ve imaginary part of coil 'impedance' can generate. So |Imag| might be what we're looking for.
LD
Sorry I take capital I as current, then we can do the i vs. j engineer vs. physicist thing.
")
Thanks, those are the levels I expected. Since you averaged I assume the lumpy phase at resonance is part of the instrument residual? BTW the Bode 100 supports Python so you have available some powerful (free) model fitting tools.
Yes, but I am much better using Excel macro's which can also be used as long as you have the Data Analysis Pak with its complex math tools.
Then the plots of inductance versus level jackinnj posted are suspect IMO.
What's more the excitation level that was applied to the coil is orders of magnitude bigger than reported, on the face of it. And that's what we're interested in alongside pulling phase info from the noise soup.
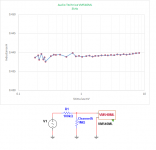
I tried placing a 100k resistor between the source and receiver, lowered the frequency to 3kHz so that the reactance of the parasitic capacitor was much higher and do an amplitude plot, setting the receiver input impedance to 1Meg -- even though the HP3577 is far better than the Bode100 at low signal levels, it's going to require some amplification.
Somewhere I have an HPIB to USB converter, but I'll get a hernia if I try to move the HP3577 -- it weighs as much as a 4th grader.
It's a work in progress, suggestions welcome.
Attachments
Last edited:
Yes, but I am much better using Excel macro's which can also be used as long as you have the Data Analysis Pak with its complex math tools.
Fair enough, we are not there yet. IIRC I was corresponding with charlielaub while he was trying the Excel optimizer for IIR filter coefficients and getting garbage out (this problem is ill-conditioned). What I meant was letting the R's, L's, and C's be free parameters and doing a least squares fit of a model to the data. This problem should not be ill-conditioned unless there is significant non-minimum phase contribution.
Thanks jackinnj. Yes, but thanks for your work so far, I think the method to look at L is sound, so long as sig levels at the cart are big enough at the instrument, and small enough at the coil so we can examine the effect we're looking for.It's a work in progress, suggestions welcome.
I think this means 40dB 50R low noise attenuator at the output of the 3577A, and a corresponding 40dB low noise 50R gain stage at the input. It only has to have enough bandwidth to cope well with audioband and 10kHz test tones. Then the instrument can be operated at levels it expects.
It's very close to being able to see what we're looking for.
LD
Not sure the instrument copes with 1M on reference input and presumably 50R on the other...……..but this doesn't change the stimulus level across the coil much, it's still much bigger than the plots report.I tried placing a 100k resistor between the source and receiver
By this argument, as to my post above, the ref input would need a separate 40dB 50R low noise amp as well. And it would need to be fairly well gain/delay matched to the 40dB amp on the main input.
LD
Last edited:
Jack,
May be I've got it wrong, but this could be the way to follow.
When you replace the 100K resistor by a 5K resistor, and go back to 50 Ohm input instead of 1Meg, you will have 40dB attenuation.
In case the HP producing -40dBM will give 22uV on the cart at 3Khz.
And when I understand your HP3577 correctly, it has -130dBm noise on its inputs when using a 10Hz BW, meaning 70nV noise on both inputs, adding up to 100nV uncorrelated noise.
With respect to the 22uV on the Cart, this 100nV resulting in a 47dB SNR, causing an insignifanct error on the measurement.
Hans
- Status
- This old topic is closed. If you want to reopen this topic, contact a moderator using the "Report Post" button.
- Home
- Source & Line
- Analogue Source
- Cartridge dynamic behaviour