Yes, right. Lucky has provided some measurements here mechanical resonance in MMs
I have used a signal generator in series with a cartridge to plot the frequency response and impedance vs freq of the electro-magnetic part in the past to good effect.
Doing it with varying signal level should be a good way to test for the dynamic behavior of a cartridge.
I am also thinking of in-vivo testing.
Playing a 33.3RPM test track at various speeds (16, 33.3, 45, 78 RPM) with a electro-dynamic cartridge (velocity sensitive) will vary the output (together with the pitch) but I am not certain of how much.
George
I have used a signal generator in series with a cartridge to plot the frequency response and impedance vs freq of the electro-magnetic part in the past to good effect.
Doing it with varying signal level should be a good way to test for the dynamic behavior of a cartridge.
I am also thinking of in-vivo
testing. Playing a 33.3RPM test track at various speeds (16, 33.3, 45, 78 RPM) with a electro-dynamic cartridge (velocity sensitive) will vary the output (together with the pitch) but I am not certain of how much.
George
Going through the archive, here's Lloyd Dixon's Texas Instruments treatment of eddy current losses, which I think is usefully balanced as to not being too math heavy, and is well presented. Overall it highlights some unexpected features of coils as relevant to eddy current loss.
www.ti.com/lit/ml/slup197/slup197.pdf
LD
www.ti.com/lit/ml/slup197/slup197.pdf
LD
Last edited:
Perhaps, but what you need is a single test record, all recorded with the same lathe, no RIAA EQ applied, and at different levels. Otherwise you have included WAY to many variables in this, like different RIAA record EQ nets, each unconfirmed, different vinyls, etc... This in no way verifies the purported dynamic FR variance.That's untrue. a) Different test records have different test levels, especially pink/white noise tracks.
Yeah, but where's all of that analysis spread over a wide dynamic range? A 2-port network does not specifically imply dynamic nonlinearities.This correlates well with observed deviation in response for some cartridges, as though deviation and level are correlated variables b) loss mechanisms have been characterised in cartridge coils as a 2-port network.
Beg to differ, but you're welcome to verify that.On the contrary, it's been an historical assumption that f response is independent of level.
Well, I've had extreme curiosity for decades. I'm not one to join dots on completely different pages, though.Unless one has curiosity enough about loose ends, join the dots or think about theoretical non-ideals, apparently it's gone unchallenged. But an assumption it is, and not a safe one. For good reasons.
The original version of your post mentioned that the use of test records was unnecessary, that we could "any broad spectrum programme content"...with fades.
I'm very glad you decided to change that, because that absolutely does not work. I hope we're not going to be dealing with other assumptions like that one.
Last edited:
Yes, right. Lucky has provided some measurements here mechanical resonance in MMs
That's the first bit of interesting information thus far. Thanks!
Sure. But the lack of such of a test record is a double edge sword. By your reasoning, neither can it ever have been shown that f response is independent of level............Perhaps, but what you need is a single test record, all recorded with the same lathe, no RIAA EQ applied, and at different levels.
This wasn't an intentional experiment originally. It arose accidentally from examination of many and various cartridges using several test records, and obtaining repeatable but cartridge specific variances. Then spotting a correlation in variance with test level. That's still a valid enough method though. But messy even to explain let alone present. It's just a marker for something that is unexpected and probably real, so as stimulate further investigation and explanation for the curious mind.Otherwise you have included WAY to many variables in this, like different RIAA record EQ nets, each unconfirmed, different vinyls, etc...
That would be messy, 2nd rate. Better to get smart and inventive with 'in-vivo' tests, targeting non-ideals using the test records we have....we could "any broad spectrum programme content"...with fades.
LD
Not true at all, but you don't currently have the right test record. There's nothing double-edged about not having the right tool.Sure. But the lack of such of a test record is a double edge sword. By your reasoning, neither can it ever have been shown that f response is independent of level............
There there should exist a data set that shows the results.This wasn't an intentional experiment originally. It arose accidentally from examination of many and various cartridges using several test records, and obtaining repeatable but cartridge specific variances.
Given the above data set, anyone should be able to extract that correlation. If we had the data.Then spotting a correlation in variance with test level.
I don't find that messy in any aspect. I find it thus far devoid of data.That's still a valid enough method though. But messy even to explain let alone present.
A trend in data should not be difficult to see and correlate. Determining cause is another matter.It's just a marker for something that is unexpected and probably real, so as stimulate further investigation and explanation for the curious mind.
It's actually worse than messy, it's impossible. You'd have a test signal that changes spectrally vs time vs level. In other words, 3 variables are built into the test signal. That disqualifies it as a test signal when trying to isolate a single external variable. Just bad science. I've used real-time spectrum analysis on program material for many decades, I know very well what those limitations are. Just to extract an repeatable spectrum you need to integrate many spectral "samples" over a long period of time. If the overall level is changing, the integration becomes dominated by high level samples, and progressively less by low level samples. It's an invalid technique, and I'm glad we can dismiss it.That would be messy, 2nd rate. Better to get smart and inventive with 'in-vivo' tests, targeting non-ideals using the test records we have.
LD
Of course.There there should exist a data set that shows the results.
But let's examine your claim that f response is independent of level. Where is your data set for that ? It's just assumption.........
LD
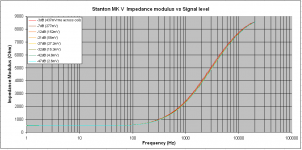
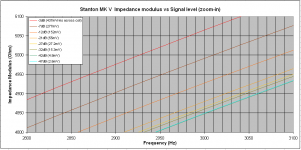
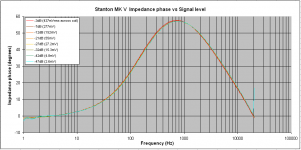
First try of MM cartridge impedance plots with varying excitation level.
I used the impedance jig that I use for measuring speaker units, only standard resistor is 500 Ohms.
M-Audio USB Audiophile soundcard. Rout=150 Ohm, Rin=10kOhm
REW software, data exported to Excel (jaddie, I can't make REW Impedance axis show above 1kOhm)
Tomorrow I will redo the test with shorter wires. I think that phase plot hints to high capacitance of the wiring.
The mVrms signal across the cartridge coil was spot measured at 100Hz
George
Attachments
Thanks George.Tomorrow I will redo the test with shorter wires. I think that phase plot hints to high capacitance of the wiring.
The mVrms signal across the cartridge coil was spot measured at 100Hz
George
Is it possible to use signal levels roughly similar to those occurring in playback, so 0dB=5mV, and a range from +10dB to -50dB or as small as is practicable to measure?
LD
Of course.
But let's examine your claim that f response is independent of level. Where is your data set for that ? It's just assumption.........
LD
Read my posts again carefully. I'm not making that claim. I'm asking you to prove yours. There is a difference.
One problem here is that stimulation of a cartridge with its stylus free of mechanical load will present an entirely different back EMF characteristic than that of a stylus mechanically loaded. Worse, you can't represent dynamic impedance accurately this way because the mechanical aspect of the modulated groove as an impedance component is absent.First try of MM cartridge impedance plots with varying excitation level.
I used the impedance jig that I use for measuring speaker units, only standard resistor is 500 Ohms.
M-Audio USB Audiophile soundcard. Rout=150 Ohm, Rin=10kOhm
REW software, data exported to Excel (jaddie, I can't make REW Impedance axis show above 1kOhm)
Tomorrow I will redo the test with shorter wires. I think that phase plot hints to high capacitance of the wiring.
The mVrms signal across the cartridge coil was spot measured at 100Hz
George
Yes, it's a known bug.First try of MM cartridge impedance plots with varying excitation level.
I used the impedance jig that I use for measuring speaker units, only standard resistor is 500 Ohms.
M-Audio USB Audiophile soundcard. Rout=150 Ohm, Rin=10kOhm
REW software, data exported to Excel (jaddie, I can't make REW Impedance axis show above 1kOhm)
The plots seem to show a broad spectrum (not frequency specific) impedance change of less than 5%. Unless your cable C was fairly high to begin with I wouldn't expect much change.Tomorrow I will redo the test with shorter wires. I think that phase plot hints to high capacitance of the wiring.
The mVrms signal across the cartridge coil was spot measured at 100Hz
George
Is the cart in an arm with the stylus resting in a groove during these tests?
One problem here is that stimulation of a cartridge with its stylus free of mechanical load will present an entirely different back EMF characteristic than that of a stylus mechanically loaded. .
How come? You are not claiming the exitation will move the stylus ? George has done tests stylus up and down and shown that there is no change. If you think about it how can there be. A cartridge is an amazingly inefficient thing. 1% at best, so you can't wiggle the stylus with a signal.
It's s motor. The energy has to go somewhere. By not placing the stylus in a groove you're just introducing another variable. Show the difference is zero, and we have the variable under control. Until that's done -- for each cartridge -- we don't know the magnitude of the effect. Could be zero, could be more, but right now you don't know.How come? You are not claiming the exitation will move the stylus ?
Can I see them please, along with full test conditions?George has done tests stylus up and down and shown that there is no change.
I'd like to see the data please.If you think about it how can there be. A cartridge is an amazingly inefficient thing. 1% at best, so you can't wiggle the stylus with a signal.
OK, so you don't know whether f response is level dependent or not. You're on the right thread then.I'm not making that claim.
LD
OK, so you don't know whether f response is level dependent or not. You're on the right thread then.
LD
Well, I'm not sure. I need some actual science here, and it's been sketchy at best.
As I've explained before, the idea is not familiar to me, and I've been at it a while.
I've asked for data, tests, proof, at least some backup or reference works, and most of all, magnitude of the issue. So far, zero. So I'm not sure if I'm not the right thread, or even in the right forum.
Well, I'm not sure. I need some actual science here,
Retard your thrust lever. It’s only engineering.
Please,and it's been sketchy at best.
I've asked for data, tests, proof, at least some backup or reference works, and most of all, magnitude of the issue. So far, zero. So I'm not sure if I'm not the right thread, or even in the right forum.
A thread in this forum starts for to dig into an issue.
It develops over time and what comes out of it is usually the result of cooperation between the participants.
No cooperation = poor results.
No actual contribution and much of criticism = slow development.
Spoon feeding = no fun.
George
Is the cart in an arm with the stylus resting in a groove during these tests?
No, the stylus was on air. Sorry for not mentioning it.
The issue of reciprocity has resurfaced many times.
You may like to visit the “Mechanical resonance in MMs” thread.
mechanical resonance in MMs
You don’t have to read past post #280 for this discussion.
George
It's s motor. The energy has to go somewhere. By not placing the stylus in a groove you're just introducing another variable. Show the difference is zero, and we have the variable under control. Until that's done -- for each cartridge -- we don't know the magnitude of the effect. Could be zero, could be more, but right now you don't know.
Can I see them please, along with full test conditions?
I'd like to see the data please.
Otherwise record clamps and mats would have no effect on the sound. Some energy of the needle movement is transferred back to the disk which then dissipates the energy in the platter, and the central pivot and record clamp. It is also a reason different density of vinyl makes the sound color different.
Actually, if a saw any engineering here I wouldn't have so many issues. I think I'd recognize it, it's what I do.Retard your thrust lever. It’s only engineering.
What I see is: An anomaly is anticipated via assumption, and perported to be "significant":A thread in this forum starts for to dig into an issue.
It develops over time and what comes out of it is usually the result of cooperation between the participants.
No cooperation = poor results.
No actual contribution and much of criticism = slow development.
Spoon feeding = no fun.
George
What does that sound like? It sounds to me like it's "audible", which is a pretty strong claim, and should be easily verified.Reality of vinyl playback is that f response of cartridge mechanics and generator electro-magnetics is typically significantly level sensitive. Then performance of an 'perfect RIAA' playback preamp, with a level-independent f response (albeit 'perfect'), can only actually be perfect at one test level.
This, as far as I know, is never discussed or documented over decades of vinyl playback preamp design. But it renders the quest for 'flat' playback preamp response meaningless, and a 'perfect RIAA' correction similarly pointless unless it corrects for the significant non-linearity of level sensitive generator f-response.
Then later:
The problem is: IF it's a "part of the vinyl sound", that should be provable. Yet, there's strong doubt about the existence of an actual "vinyl sound" caused by the lathe, lacquer, vinyl and cartridge (once properly tracking RIAA) apart from differences in the preceding chain (mastering, and the master itself).I first encountered significant level-sensitive parameters about 6 years ago in collaboration with David Laloum trying to 'perfectly' terminate MM carts, where cartridge inductive behaviour, and hence the generator (not least LCR resonant f and Q), apparently changed significantly dependant upon test level for some cartridges. Especially for very small signals. I still have the charts from that work, and stand by that it is very probably real and a part of vinyl sound.
I've seen no actual evidence presented here, only one slight indication of a dynamic change in impedance, followed by another plot that showed none. Lots of chat about resonances, mechanical and electrical (none of that is news), but that's about it.
No good science or engineering so far.
Let me be clear: I'm not saying dynamic FR changes do not exist! I'm questioning:
1. The existence of dynamic FR changes
2. If it exists, to what magnitude, specifically F0, Q, and range of gain
3. Once we have that, we can apply response audibility curves from prior work and determine audibility.
I'm thinking of doing some research here too, time and other limits not withstanding. I still have my masters and vinyl pressings to do my own dynamic FR tests, so when I'm more on my feet and can move some gear, I may get that together.
I still anxiously await hard data. If you think about it, characterizing d-FR could contribute significantly a DSP vinyl-sound emulation.
Last edited:
- Status
- This old topic is closed. If you want to reopen this topic, contact a moderator using the "Report Post" button.
- Home
- Source & Line
- Analogue Source
- Cartridge dynamic behaviour