I've been modifying a cheap commercial 3-transistor phono stage as a little hobby project to see how good it can sound. I've been messing with the RIAA filter lately, but this is a bit hit or miss without having an accurate way of measuring the response. I tried generating a RIAA equalized frequency sweep using Audacity and then playing it back through the phono stage making a recording and doing a spectrum analysis on the resulting recording. The results were not good, they weren't precise enough to really be able to use them for finetuning the response. The best they could do was confirm what my ears were telling me - that there was a slight rise happening from 10kHz onwards and that there was some bass rolloff. But that treble rise for example could've been +0.2dB or +0.7dB for all I could gather from the spectral analysis.
So I'm looking for a way to get more accurate recordings and analysis - basically I'd like to feed the phono stage something (pink noise? frequency sweep?), record that and analyze it in a way that gives me a nice, precise line from 20-20kHz where I can see it's down 0.1dB at 200Hz and up 0.2dB at 2kHz etc.
I'd think this should be relative easy to accomplish using the right tools, but I'm not sure what those might be, so I'm asking if anyone has been through this road (with Linux software hopefully) and to share their experience and what tools they used. Thanks!
Number of ways to do this. Either flat sweep then add a reverse RIAA curve in SW or generate a sweep with RIAA added so you get flat out. Why did your attempts at this fail? Audacity has an FFT tool that should be up for the job.
If you post your circuit then someone can probably simulate the network and tell you what's wrong.
If you post your circuit then someone can probably simulate the network and tell you what's wrong.
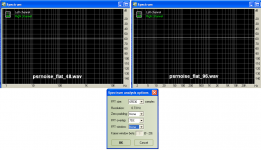
Download one of these files (48kHz or 96kHz sampling) that Scott Wurcer has made public and use it to drive the input of your RIAA preamplifier. Record the output. It should be flat.
https://linearaudio.net/sites/linearaudio.net/files/psrnoise_IRIAA_48.wav
https://linearaudio.net/sites/linearaudio.net/files/psrnoise_IRIAA_96.wav
George
https://linearaudio.net/sites/linearaudio.net/files/psrnoise_IRIAA_48.wav
https://linearaudio.net/sites/linearaudio.net/files/psrnoise_IRIAA_96.wav
George
There is also the freeware Equalizer app available from Brian Davies (famously the author of ClickRepair, for cleaning clicks and pops from phono albums being transcribed to digital), which has a reverse RIAA function. MacOS / WindowsOS / LinuxOS and has been around for more than a decade.
Equalizer – an alternative to electronics | Audio Restoration | Brian Davies
Equalizer – an alternative to electronics | Audio Restoration | Brian Davies
Thanks a lot for the suggestions. I think I'm not gelling with the FFT analyzer in audacity. I can't get a straight line out of it no matter what I do, even creating frequency sweeps or different noise spectrums in the software, they are always sloping some way and have a lot of spikes. I think some sort of smoothing in analyzing phase would be needed to even out all those small spikes which would already go a long way, but that would still leave the response graph sloping some way which makes things trickier.
What I ended up doing in my initial tests was create a frequency sweep, then EQ the **** out of that to get it to resemble a straight line in the audacity spectrum analyzer (which still left me with some peakiness at places), then apply reverse RIAA to that (hoping the audacity RIAA preset is accurate), play it back through the phono stage and then analyze that file. Using this method I got somekind of result out of it, but with all the peakiness especially in the lower frequencies, it's not as easy to read as I'd like.
I will try with the files provided or with the linked software + look into finding a different FFT analyzer.
I have simulated the circuit in LTspice and use that as the basis for the modifications, but there's not a model for the exact transistor used (STC945) so I've used 2SC945 and 2SC1815 (which is what earlier version of the TC-750 seemed to use) and I think the realworld response falls somewhere between the two simulations. Speaking of LTspice, the kind of plotting you get from LTspice simulation is what I'm after")
What I ended up doing in my initial tests was create a frequency sweep, then EQ the **** out of that to get it to resemble a straight line in the audacity spectrum analyzer (which still left me with some peakiness at places), then apply reverse RIAA to that (hoping the audacity RIAA preset is accurate), play it back through the phono stage and then analyze that file. Using this method I got somekind of result out of it, but with all the peakiness especially in the lower frequencies, it's not as easy to read as I'd like.
I will try with the files provided or with the linked software + look into finding a different FFT analyzer.
I have simulated the circuit in LTspice and use that as the basis for the modifications, but there's not a model for the exact transistor used (STC945) so I've used 2SC945 and 2SC1815 (which is what earlier version of the TC-750 seemed to use) and I think the realworld response falls somewhere between the two simulations. Speaking of LTspice, the kind of plotting you get from LTspice simulation is what I'm after
What sort of sound card or usb audio codec are you using for this? A loop back test with a good one should be +/-0.1dB or better over 20Hz - 20kHz. Make sure all wiring is well shielded and use a resistive attenuator on the output of the sound card to attenuate the signal to a level suitable for your phono pre-amp.
About 40dB of attenuation would be right.. (9.9K/100 ohms made with combinations of 1% or better resistors)
For good "generator" linearity set the output in software 6 - 10dB below 0dBFS..
About 40dB of attenuation would be right.. (9.9K/100 ohms made with combinations of 1% or better resistors)
For good "generator" linearity set the output in software 6 - 10dB below 0dBFS..
You can simulate it with LTSpice.
Use a source with the inverse RIAA Laplace function and the output should have a flat response. Any deviations are obvious
See ltspice - Turning a Subcircuit block into a Transfer Function for faster simulation in SPICE - Electrical Engineering Stack Exchange
Use a source with the inverse RIAA Laplace function and the output should have a flat response. Any deviations are obvious
See ltspice - Turning a Subcircuit block into a Transfer Function for faster simulation in SPICE - Electrical Engineering Stack Exchange
Example code for Inverse RIAA. Save this as a .asc file
Version 4
SHEET 1 880 680
WIRE 32 96 32 64
WIRE -16 112 -144 112
WIRE -144 128 -144 112
WIRE -16 160 -32 160
WIRE 32 192 32 176
WIRE -144 240 -144 208
FLAG 32 192 0
FLAG -32 160 0
FLAG -144 240 0
SYMBOL e 32 80 R0
WINDOW 3 28 94 Left 2
SYMATTR Value Laplace=1/((1+318e-6*s)/((1+75e-6*s)*(1+3180e-6*s)))
SYMATTR InstName E1
SYMBOL voltage -144 112 R0
SYMATTR InstName V1
SYMATTR Value ac 1
TEXT -56 248 Left 0 !.ac oct 100 1 100K
I think I'm not gelling with the FFT analyzer in audacity. I can't get a straight line out of it no matter what I do,
I will try with the files provided or with the linked software + look into finding a different FFT analyzer.
Scott’s files are to be analysed using no window (i.e. rectangular window) function.
In Audacity, for some unknown reason, the spectrum shows flat only in Linear frequency . With log frequency there is heavy unevenness at low frequency.
You may use any free version of RMAA to do decent FFT plots
Latest News. Audio Rightmark
George
Attachments
Audacity's "plot spectrum" function works just fine, it just is the wrong too. It's an FFT with fixed bandwidth regardless of frequency.
Pink noise has equal energy per octave, which is not "flat" at all, but falling with rising frequency. It won't display as flat on a fixed bandwidth FFT, but will display as "flat" on a real-time analyzer with fixed octave (or fractional octave) filters, as each progressively higher analyzer band includes progressively more of the spectrum.
Using Pink noise with inverse RIAA applied (you can generate that in Audacity) and then try Room EQ Wizard, using the RTA function for analysis. The result should be flat, and easy to read to high resolution.
So far nobody mentioned pink noise.Audacity's "plot spectrum" function works just fine, it just is the wrong too. It's an FFT with fixed bandwidth regardless of frequency.
Pink noise has equal energy per octave, which is not "flat" at all, but falling with rising frequency. It won't display as flat on a fixed bandwidth FFT, but will display as "flat" on a real-time analyzer with fixed octave (or fractional octave) filters, as each progressively higher analyzer band includes progressively more of the spectrum.
Using Pink noise with inverse RIAA applied (you can generate that in Audacity) and then try Room EQ Wizard, using the RTA function for analysis. The result should be flat, and easy to read to high resolution.
Although very well possible, why make things more complicated to process.
I support the suggestion that George has made to use the "anti riaa processed white noise" .wav files that Scott has made available.
Hans
So far nobody mentioned pink noise.
Although very well possible, why make things more complicated to process.
I support the suggestion that George has made to use the "anti riaa processed white noise" .wav files that Scott has made available.
Hans
The problem is Audacity, and making high resolution measurements with noise of any kind. There's no smoothing. White noise has most of its energy concentrated in the upper half of the spectrum. If you use white noise you have to set the FFT to higher samples to get low end response, and that just kicks up the detail, which displays lots of response excursions to confuse.
Using inverse RIAA pink, an RTA (any kind with 1/12 octave or higher res, REW is great and free) takes care of both issues.
It's not complicating things to use the right tools.
Another thought on REW: Since you can enter a target curve, no inverse RIAA anything is needed. You can use its pink noise and RTA, or even use a (gasp!) high resolution sweep! It will reference against the target curve and display deviation from it. With whatever smoothing you like this week.
Geez, that sounds like a pretty good idea to me.
Oh, and there's a system calibration procedure to null out any problems with sound cards.
Geez, that sounds like a pretty good idea to me.
Oh, and there's a system calibration procedure to null out any problems with sound cards.
My 2p worth on RIAA playback accuracy.
It can be satisfying, a learning challenge, and to some extent relatively easy to design and build a near-ideal performing playback preamp.
However, there's an elephant in the room. Reality of vinyl playback is that f response of cartridge mechanics and generator electro-magnetics is typically significantly level sensitive. Then performance of an 'perfect RIAA' playback preamp, with a level-independent f response (albeit 'perfect'), can only actually be perfect at one test level.
This, as far as I know, is never discussed or documented over decades of vinyl playback preamp design. But it renders the quest for 'flat' playback preamp response meaningless, and a 'perfect RIAA' correction similarly pointless unless it corrects for the significant non-linearity of level sensitive generator f-response.
Which is never done.............................
So sweat-ye-not about measurement accuracy of RIAA correction, so long as it's reasonable by design. Playback tests will almost always show errors, which are real, because they are made at a single level. It's the wrong thing to tune overall f response to be 'flat' on the basis of tests made at a single level. That's my opinion, based on years of seeking the 'perfect' response.
LD
Last edited:
Please provide a reference for this so that we can see what "significantly level sensitive" is.Reality of vinyl playback is that f response of cartridge mechanics and generator electro-magnetics is typically significantly level sensitive. Then performance of an 'perfect RIAA' playback preamp, with a level independent f response (albeit 'perfect'), can only be perfect at one test level.
having built many phono preamps I looked for something to check the correct filtering of the RIAA network and I found this circuit with accurate info :
http://www.pcb-audio.com/downloads/accurate-inverse-riaa.pdf
http://www.pcb-audio.com/downloads/accurate-inverse-riaa.pdf
I agree that a perfect Riaa curve only tells that it is a perfect Riaa curve, but not all about the real FR from Cart / LP.Reality of vinyl playback is that f response of cartridge mechanics and generator electro-magnetics is typically significantly level sensitive. Then performance of an 'perfect RIAA' playback preamp, with a level-independent f response (albeit 'perfect'), can only actually be perfect at one test level.
This, as far as I know, is never discussed or documented over decades of vinyl playback preamp design. But it renders the quest for 'flat' playback preamp response meaningless, and a 'perfect RIAA' correction similarly pointless unless it corrects for the significant non-linearity of level sensitive generator f-response.
Which is never done.............................
LD
Wasn't the idea to have the sensitivity issue addressed with the test LP ?
Hans
It is incorrect that white noise has most energy concentrated in the upper half of the spectrum.The problem is Audacity, and making high resolution measurements with noise of any kind. There's no smoothing. White noise has most of its energy concentrated in the upper half of the spectrum. If you use white noise you have to set the FFT to higher samples to get low end response, and that just kicks up the detail, which displays lots of response excursions to confuse.
Using inverse RIAA pink, an RTA (any kind with 1/12 octave or higher res, REW is great and free) takes care of both issues.
It's not complicating things to use the right tools.
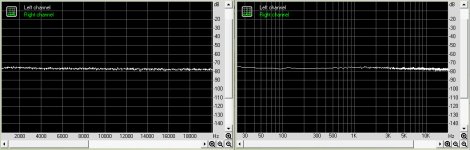
That may seem to be when displaying the spectrum on a log scale.
However when switching to a linear scale, you can see that noise is evenly distributed all over the spectrum.
See images below lin and log from 20Hz to 20 Khz made with a Scott anti Riaa .wav file played through a Riaa filter.
It fully confirms without confusion that the noise used was white and that the anti riaa correction was well done.
Hans
Attachments
My 2 cents- trying to measure RIAA accuracy directly requires a measurement system of wide dynamic range and little noise. Though it can be done, it's a fool's errand if you're looking for 0.1 dB or less. Best path with that method would involve a precision ratio transformer that most people don't have. Build an inverse RIAA circuit so you can treat the system as essentially flat. I like the one here- http://www.hagtech.com/pdf/riaa.pdf
- Status
- This old topic is closed. If you want to reopen this topic, contact a moderator using the "Report Post" button.
- Home
- Source & Line
- Analogue Source
- Measuring phono stage RIAA accuracy with a computer