I usually manually measure the response to sine waves of various frequencies with an oscilloscope and then use Excel or LibreOffice Calc to check whether it is compliant with the RIAA standard. It should also be posssible without scope; with a 100:1 resistive attenuator in front of the amplifier you could measure the response through the attenuator and amplifier and straight from soundcard output to soundcard input, and use the ratio for further calculations.
Yes, addressing level-sensitive f-response was the point of suggested test tracks. But, last time I looked that had been taken out, and prior to that a set of test levels that wouldn't address the issue, couldn't be cut (yet alone played) was proposed......I agree that a perfect Riaa curve only tells that it is a perfect Riaa curve, but not all about the real FR from Cart / LP.
Wasn't the idea to have the sensitivity issue addressed with the test LP ?
Hans
The issue crops up as significant variance in f response results conducted at various single levels, from pre-amps that should otherwise produce honest and predictable results.
Not only does it have basis in both electro-magnetics and mechanics losses/non-linearities, the phenomenum is necessary to consolidate all manner of observed f response observed oddities.
It's just an elephant.
LD
If you can borrow from somewhere a constant amplitude AF sine wave generator and a good RMS Voltmeter with a dB scale, that can handle up to 20kHz, then the task can be greatly simplified. I use a vintage Hewlett Packard HP209A, feeding a 30dB attenuator as source and monitor the RIAA output on a vintage Hewlett Packard HP3400A. The 3400A is the version with dB scale on top rather than voltage. I set the 209A to give around 4mV input to the RIAA amp and finely set for 0dB on the 3400A at 1kHz sine wave. From there one just has to set the 209 to the required frequencies and note the 3400 dB reading. It's also a good idea to check the flatness of your test gear, including cables and attenuator, over the full frequency range, before you couple it to the amp being tested. Standard procedure for us old pro's testing items in the workshop.
True, but FR measurements using a linear scale are useless. White noise has equal intensity at different frequencies, giving it a constant power spectral density. That doesn't work for FR measurements with linear FFT or log RTA. It's of limited usefullness in this application.It is incorrect that white noise has most energy concentrated in the upper half of the spectrum.
That may seem to be when displaying the spectrum on a log scale.
However when switching to a linear scale, you can see that noise is evenly distributed all over the spectrum.
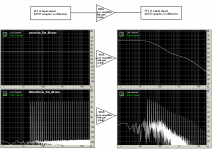
See images below lin and log from 20Hz to 20 Khz made with a Scott anti Riaa .wav file played through a Riaa filter.
It fully confirms without confusion that the noise used was white and that the anti riaa correction was well done.
Hans
Sure, but when you're designing an RIAA EQ net you need to start somewhere, and will probably need repeated FR measurements to get it right. Then, once that's done, cart interface is next, with R and C loading adjusted for proper playback of a non-EQ'd test record (STR100 is my choice).I agree that a perfect Riaa curve only tells that it is a perfect Riaa curve, but not all about the real FR from Cart / LP.
Wasn't the idea to have the sensitivity issue addressed with the test LP ?
Hans
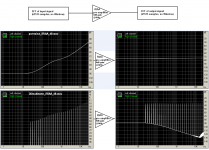
Well, if helma has been confused, following the simple approach I suggested in post# 3, he should expect these results (see attachments)
Scott’s files can be downloaded from Linear Audio site, download section (thank you Jan)
https://linearaudio.net/sites/linearaudio.net/files/psrnoise_flat_48.wav
https://linearaudio.net/sites/linearaudio.net/files/psrnoise_IRIAA_48.wav
https://linearaudio.net/sites/linearaudio.net/files/30multitone_flat_48.wav
https://linearaudio.net/sites/linearaudio.net/files/30multitone_IRIAA_48.wav
George
Attachments
My 2 cents- trying to measure RIAA accuracy directly requires a measurement system of wide dynamic range and little noise. Though it can be done, it's a fool's errand if you're looking for 0.1 dB or less. Best path with that method would involve a precision ratio transformer that most people don't have. Build an inverse RIAA circuit so you can treat the system as essentially flat. I like the one here- http://www.hagtech.com/pdf/riaa.pdf
I usually manually measure the response to sine waves of various frequencies with an oscilloscope and then use Excel or LibreOffice Calc to check whether it is compliant with the RIAA standard. It should also be posssible without scope; with a 100:1 resistive attenuator in front of the amplifier you could measure the response through the attenuator and amplifier and straight from soundcard output to soundcard input, and use the ratio for further calculations.
All that can work, but I thought the point here was simplicity and precision. The above is the epitome of tedium and the very definition of cumbersome.
Today we have better tools, mostly at minimal cost or free. Something like Room EQ Wizard (REW) or TrueRTA can handle the analysis quickly and effectively. REW is a full test bench of sophisticated tools, several analyzers, THD, THD+N, RTA and really cool swept sine/FFT. Take all that effort of entering data into a spread sheet and enter the RIAA curve ONCE, as a target curve, and you'll have a fully compensated FR analysis using noise or swept sine that will display perfectly flat when the curve is dead on. The cost is a good sound card/external USB, and a bit of time to learn the software.
You can also play the swept -15 20-20K track of the STR100 and end up with an FR plot, then tweak cart loading.
All my Tektronix and HP gear sits collecting dust now/. I don't have the time or patiences for it, and desire better precision anyway.
Yes, addressing level-sensitive f-response was the point of suggested test tracks. But, last time I looked that had been taken out, and prior to that a set of test levels that wouldn't address the issue, couldn't be cut (yet alone played) was proposed......
The issue crops up as significant variance in f response results conducted at various single levels, from pre-amps that should otherwise produce honest and predictable results.
Not only does it have basis in both electro-magnetics and mechanics losses/non-linearities, the phenomenum is necessary to consolidate all manner of observed f response observed oddities.
It's just an elephant.
LD
Again...references please! A reference is a paper, article, charts, graphs...at least some documentation of this "effect".
There is a frequency-based maximum level issue based on geometry and physical stylus velocity, but it's a maximum not an FR issue, it's a maximum level issue vs frequency. I trust that's not what we're talking about.
My 2 cents- trying to measure RIAA accuracy directly requires a measurement system of wide dynamic range and little noise. Though it can be done, it's a fool's errand if you're looking for 0.1 dB or less
Hi Conrad.
It can be done. Care only not to overload the preamplifier.
Link is from real measurement using soundcard recording.
DUT is a 2x4miniDSP module acting as a RIAA equaliser. Max output level is 0.9Vrms
http://www.diyaudio.com/forums/atta...ing-vinyl-2-dual-biquad-48k-riaa-response-png
George
>Edit
Here is the source post
Digitizing vinyl
Please visit also this post for details about how the measurement was done (essentially, like jaddie has outlined in post #27 above)
Digitizing vinyl
Obviously no. Rather, it concerns mechanical and electro-magnetic losses and loss non-linearities which vary with level or slew rate. Such as cantilever flex, elastomer non-linearities, eddy current losses, hysteresis losses, non-linear b-h curves, displacement dependent b field non-linearities, etc etc..........There is a frequency-based maximum level issue based on geometry and physical stylus velocity, but it's a maximum not an FR issue, it's a maximum level issue vs frequency. I trust that's not what we're talking about.
I doubt you'll find references, because for whatever reason back in the day a whole raft of non-linearities such as these went under the radar. At least as far as the popular press and hifi public was concerned. Whether it was known and understood by cartridge R&D bods is another matter I suppose.
And so we the hifi public became conditioned to think of f response as level independent. But it ain't so for vinyl playback, and for good reasons.
LD
Obviously no. Rather, it concerns mechanical and electro-magnetic losses and loss non-linearities which vary with level or slew rate. Such as cantilever flex, elastomer non-linearities, eddy current losses, hysteresis losses, non-linear b-h curves, displacement dependent b field non-linearities, etc etc..........
I doubt you'll find references, because for whatever reason back in the day a whole raft of non-linearities such as these went under the radar. At least as far as the popular press and hifi public was concerned. Whether it was known and understood by cartridge R&D bods is another matter I suppose.
And so we the hifi public became conditioned to think of f response as level independent. But it ain't so for vinyl playback, and for good reasons.
LD
Here's my problem with this. Every other vinyl-related anomaly has been documented to death, tracking angles, VTA, stylus shape, and dozens of others. Yet, you say this one flew under the radar? Then how do you claim to know about it? If it caused an error of several dB, to the point where it was clearly audible, I think it would certainly be documented.
Here's the thing: Vintage vinyl was cut from analog tape. Analog tape has FR variations with frequency...often big ones, several dB at the extremes. The vinyl system has a rather horrific maximum modulation curve, and many masters were cut with automatic gain control devices (limiters) which action is by necessity frequency selective in it's action.
Yet, if done carefully, vinyl doesn't actually have a "sound" caused by response errors. I know this first hand, having actually cut several projects, had the entire chain under control, and compared to the master.
I'm going to have to disagree with your premise unless you can provide actual data. Otherwise it's unsubstantiated hearsay.
Anyways, another time, another place. Not wishing to derail the thread I'll bow out having made my point.
LD
Which was (prior to deletion)"there's no sense going overboard over measuring preamp RIAA performance."
I agree totally, but for very different reasons.
Well no actually. One doesn't doesn't have to pull too hard at the abundant loose ends in archive material to realise there's still plenty that lacks proper explanation, and plenty of uncharted water.Here's my problem with this. Every other vinyl-related anomaly has been documented to death, tracking angles, VTA, stylus shape, and dozens of others.
You obviously don't know me or the body of work and time I invested over the years in understanding vinyl playback technology.Yet, you say this one flew under the radar? Then how do you claim to know about it?
Well, think again. There are plenty of 'known' anomalies in classic f response which still lack proper explanation, and vary with level.If it caused an error of several dB, to the point where it was clearly audible, I think it would certainly be documented.
Disagreeing is your prerogative. But the mechanisms involved are self-evident and obvious. You could, of course spend the best part of a decade researching, thinking through, testing, posting thousands of results, and measuring as I have. Take a look.I'm going to have to disagree with your premise unless you can provide actual data. Otherwise it's unsubstantiated hearsay.
Anyways, I don't mean to derail the thread, and I'll bow out now. I made my point that it's pointless to go overboard on designing or measuring very accurate RIAA preamps. But hey I don't deny it's fun, and I've been there and done it.
LD
Last edited:
Hi George,Well, if helma has been confused, following the simple approach I suggested in post# 3, he should expect these results (see attachments)
George
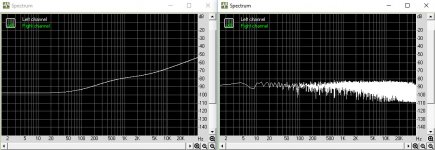
How did you produce your smooth Riaa corrected curve from Scott's IRiaa curve.
I used LTspice to send Scott's 96K file through a Riaa filter and produced a new 96K .wav file from the result, but you obviously used a different approach.
With a 65K FFT, my results are in the left image below, before and after Riaa.
But I have a problem in understanding RMAA, because when taking a 32K FFT from Scott's file, thereby doubling the filter bin width, see image at the right, I would expect an even smoother image than the 65K FFT image at the left.
Unexplicably this is absolutely not the case ??
Hans
Attachments
Some years ago, I tried to adress the generators nonlinearity by placing an old cart with worn stylus of the same brand in the feedback loop of the first stage.
It worked — for a few minutes when the opamps dc-output or the signal strength killed the coil. I thought it sounded nice, but then any new idea i try sounds nice in the beginning...
It worked — for a few minutes when the opamps dc-output or the signal strength killed the coil. I thought it sounded nice, but then any new idea i try sounds nice in the beginning...
But I have a problem in understanding RMAA, because when taking a 32K FFT from Scott's file, thereby doubling the filter bin width, see image at the right, I would expect an even smoother image than the 65K FFT image at the left.
Unexplicably this is absolutely not the case ??
Hans
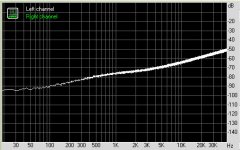
Hans the maths don't work that way, the files are set to work at a single sampling frequency without windowing. Decimation by two (using 32k FFT, has mathematical artifacts from imaging/aliasing). I keep having this problem with making files for folks.
All that can work, but I thought the point here was simplicity and precision. The above is the epitome of tedium and the very definition of cumbersome.
I was under the impression that the main issue was accuracy. Using an analogue scope with cursors and a 1:1 probe and using the same scope channel for the input of the attenuator and the output of the amplifier, the measurements are usually reproducible within 0.1 dB or so and the result is usually flat within 0.1 dB over the frequency range where you would expect good RIAA conformity. Although I never tried, I guess similar reproducibility should be possible with a soundcard when you use the same recording channel for attenuator input and amplifier output. Unless you do something very unusual in the design, the deviation from an ideal RIAA response will be rather smooth, so measuring one point per octave will be enough.
By the way, entering an ideal RIAA response in a spreadsheet is just a matter of typing
=10*LOG10((1+(A5*2*PI()*0.00318)^2)*(1+(A5*2*PI()*0.000075)^2)/(1+(A5*2*PI()*0.000318)^2))-10*LOG10((1+(1000*2*PI()*0.00318)^2)*(1+(1000*2*PI()*0.000075)^2)/(1+(1000*2*PI()*0.000318)^2))
when the frequency is in cell A5. The term -10*LOG10((1+(1000*2*PI()*0.00318)^2)*(1+(1000*2*PI()*0.000075)^2)/(1+(1000*2*PI()*0.000318)^2))
is only there to make the result equal to 0 dB at 1 kHz.
I'm sure there are faster methods to do these measurements, but when you only measure a RIAA response a few times in your life, why not keep it simple and measure things by hand?
Yes, I also tried this with partial success a few years back. But many mechanical and spatial/motion non-linearities can't be replicated this way. And one needs to keep signal levels similar as would occur in the generator both to be effective, and to avoid crispy-fried-duck syndromeSome years ago, I tried to adress the generators nonlinearity by placing an old cart with worn stylus of the same brand in the feedback loop of the first stage.
It worked — for a few minutes when the opamps dc-output or the signal strength killed the coil. I thought it sounded nice, but then any new idea i try sounds nice in the beginning...
")
Another time, another place.
LD
I thought it sounded nice, but then any new idea i try sounds nice in the beginning...
 This is one of the biggest problems in audio and one that the marketing men exploit to the bitter end
- Status
- This old topic is closed. If you want to reopen this topic, contact a moderator using the "Report Post" button.
- Home
- Source & Line
- Analogue Source
- Measuring phono stage RIAA accuracy with a computer