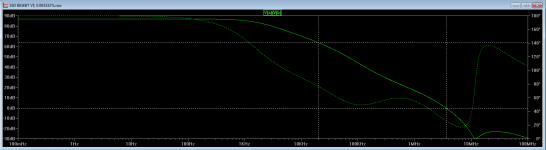
Attached I have a gain/phase plot for an amplifier (an actual sample sits on my desk and plays fine ") ). My question (about the plot) is, how do I read the phase margin from the plot, it never goes through 180 deg (actually 0 deg but it is inverting).
). My question (about the plot) is, how do I read the phase margin from the plot, it never goes through 180 deg (actually 0 deg but it is inverting).
Edit:
Graph: Method 'Middlebrook' (post #1) as per the 'LoopGain.asc'-sample that is included with LTspice.
Edit:
Method 'Bob Cordell' at post #7 http://www.diyaudio.com/forums/analogue-source/247253-gain-phase-margin.html#post3734016
Edit:
Method 'Wiedmann' at post #12 http://www.diyaudio.com/forums/analogue-source/247253-gain-phase-margin-2.html#post3734476
). My question (about the plot) is, how do I read the phase margin from the plot, it never goes through 180 deg (actually 0 deg but it is inverting).Edit:
Graph: Method 'Middlebrook' (post #1) as per the 'LoopGain.asc'-sample that is included with LTspice.
Edit:
Method 'Bob Cordell' at post #7 http://www.diyaudio.com/forums/analogue-source/247253-gain-phase-margin.html#post3734016
Edit:
Method 'Wiedmann' at post #12 http://www.diyaudio.com/forums/analogue-source/247253-gain-phase-margin-2.html#post3734476
Attachments
Last edited:
Is that a plot of loop gain or closed-loop gain?
Middlebrook as per the 'LoopGain.asc'-sample that is included with LTspice.
Sorry, I don't understand. What is 'Middlebrook'?
See the attached file
My problem with it is this, I have here Bob Cordels book and it shows how to read gain and phase margin from the graph, but I can not implement it due to the fact that the plot does not go through 180 deg. basically my question is, what now?
Attachments
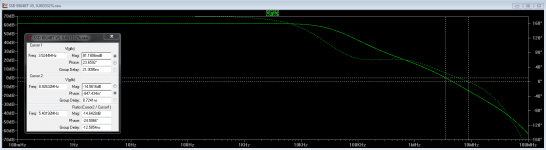
This is a new try, now using the 'Bob Cordell'-method (insert a large inductor in the feedback loop). This looks better (at the least I can get the numbers).
Gain margin 14.5 dB
Phase margin 24.5 deg
This bring an other question to mind, why did the previous method not work, the 'Bob Cordell' method (at the least for me) was expected to be less precise. What is the preferred way of getting these numbers?
Gain margin 14.5 dB
Phase margin 24.5 deg
This bring an other question to mind, why did the previous method not work, the 'Bob Cordell' method (at the least for me) was expected to be less precise. What is the preferred way of getting these numbers?
Attachments
Last edited:
Hi
just an observation .... how is it you have more gain in the first plot than the second , when the second plot should be open loop gain .
That's the question I am asking, what method to use and why. The both methods I used measure 'loop-gain' (and phase). There is a 3rd method (also comes with LTspice) that I will try and publish tonight. All the plots are taken from the same schema (with all the same values, except for the measurement method added).
Hi
just an observation .... how is it you have more gain in the first plot than the second , when the second plot should be open loop gain .
my apologies bob is applying the generator at the feedback point and so he measures loop gain that way .
Last edited:
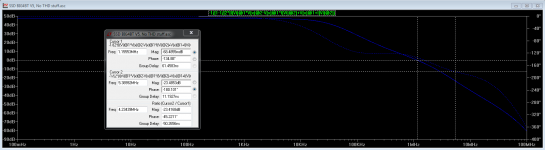
And here is the 3rd method, the method 'Wiedmann', this method evaluates voltage and current gain.
This method shows:
Gain margin: 23.5 dB
Phase margin: 45 deg
3 methods 3 results
This method is described in the attached file LoopGain2.asc
This method shows:
Gain margin: 23.5 dB
Phase margin: 45 deg
3 methods 3 results
This method is described in the attached file LoopGain2.asc
Attachments
Last edited:
- Status
- This old topic is closed. If you want to reopen this topic, contact a moderator using the "Report Post" button.
- Home
- Source & Line
- Analogue Source
- Gain/Phase margin