Hi Everyone,
I am away from my soldering iron for a while, but I have my computer with me, so I have been modeling different power supply options in PSUD2 for a couple projects waiting back home.
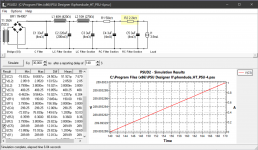
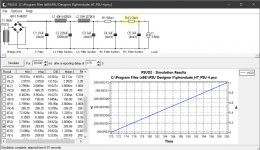
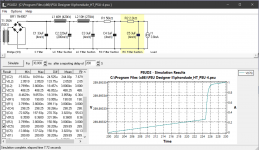
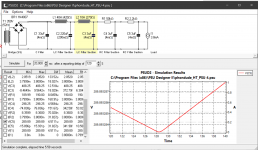
There is a recurring theme to these models: strange "V" shaped lines or sometimes slopes for the voltage graphs. These show up if I chose a delay for the sample period. The images below were sampled after a delay of 120 seconds.
Is this a sign of oscillation in the power supply?
see the two attached images for a phono preamp. One is the power supply as suggested on the schematic, and the second is a model of a PS based on parts in my scrap box.


Thanks Nigelwright7557,
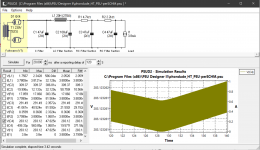
I appreciate the response. This is what I felt, too, but some configurations brought up straight lines-- or bars really-- showing just the ripple.
The modulation (bending of the bar) of the voltage plot shown above seemed a little odd, but I couldn't quite decide if it was just an anomaly of PSUD2, or something I should try to iron out. (or as you suggest, not to worry because we are only looking a a few micro volts difference).
The graphs plotted with no delay on the sample period look nice and smooth. No ringing.
At a guess in the second pic. if you extended the time window to 100-140 seconds you'll see an oscillation and slight increase in voltage as the PSU caps continue to charge, I don't think it's completely reached a steady state yet with that humongous iron and capacitance downstream of the load. Mind you the ripple is pretty much non-existent.
Might I ask if all this is stuff in the parts bin, because otherwise with the cost of the iron chosen, caps with 2ohm ESR are an anomaly since this can easily be improved for small bucks?
Might I ask if all this is stuff in the parts bin, because otherwise with the cost of the iron chosen, caps with 2ohm ESR are an anomaly since this can easily be improved for small bucks?
Hi Jazid,
Thanks for your response.
I will extend the time and see what it looks like. Didn't know I could make the sample period that long, actually.
The second one with the thin red "V" represents parts in the spares box. Leftovers from various projects.
But for small bucks, I don't mind placing a small order.
What did you have in mind?
Quick expalnation:
(the 2ohm caps in the first chart are just the PSUD2 default. The ESR in the second chart are rounded off from spec sheets)
(The schematics represent the whole chain of filtering including the inter-stage decoupling. The basic DC supply ends after the second choke. I was just seeing if I could get away with using the 3uf caps later in the chain, or if the schematic's suggestion of 47uf was necessary to achieve low ripple.)
My estimation of what you are observing is a commonality to many, many numerical modeling systems. Especially when you are considering a transient, non-linear solver. Given the non-linear mathematics introduced by magnetics, a transient solution to that non-linear system of equations is very likely to employ an iterative relaxation method, such as Point-Jacobi or Gauss-Seidel, to determine the "result" at each time step. The tolerance to which that iterative solver converges is finite and there is a tradeoff between accuracy and the number of iterations required. In this case what you may be observing is this inaccuracy between successive solution steps.
I don't have any visibility into PSU-DII but lTspice gives little messages at the bottom of the screen about corrective alterations to the solver's parameters. My quickest speculation is summarized as: numerical solution techniques retain small amounts of error, which can be visible in adjacent time steps.
I don't have any visibility into PSU-DII but lTspice gives little messages at the bottom of the screen about corrective alterations to the solver's parameters. My quickest speculation is summarized as: numerical solution techniques retain small amounts of error, which can be visible in adjacent time steps.
> Strange graph in PSUD2 (oscillation?)
The physical system CAN'T oscillate (assuming everything ideal-- WiFi and other crap will throw oscillations into any real build).
You are looking MUCH too close. Nothing in here individually moves slower than a second. Yes, if you zoom-in to NANOvolts, you can see it is "still climbing" at 30 seconds-- the rise extends to infinity. This comes to the old joke about the mathematician and the engineer. #2
The program is approximating a continuous system with numbers of limited precision. There WILL be round-off errors. Each one small, but after a zillion iterations they can start to show at the NanoVolt level. Long repeated computations CAN "oscillate" if they get between a round-up and a round-down point. Your latest shows that this complicated algorithm can "jump" if rounding crosses some critical point. My uncle could explain this all to you (you could not afford his rates).
This is "just an amplifier". You don't need all that precision. 270V or 290V makes no difference to us. Sub-mV ripple is usually good.
Current-sources are *always* problematic in this type of simulation. (They should be current limiters but PSUD's current-things seem to source power, which "fights" the power coming from the line.) Use a 71k resistor instead.
And 3.8mA is mighty darn small to justify a choke, especially in this world of cheap electrolytics. Another stage of R-C filter will get you to the same point, in less space and much less cost.
Last edited:
- Status
- This old topic is closed. If you want to reopen this topic, contact a moderator using the "Report Post" button.
- Home
- Amplifiers
- Tubes / Valves
- Strange graph in PSUD2 (oscillation?)
