
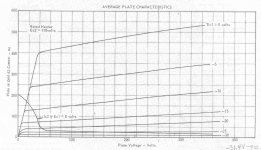
If I put a ruler across the tube 1 plate curves above (post 1482 pic 1) at about 150V and 10 mA I get 1 mA variation across 5 horiz. divisions (5 x 50V), giving 250K Rp. If I do the same with the GE datasheet curves, I get 1 tiny division (0.4 mA) per 300V, giving 750K Rp! About 3X what the datasheet states (280K). I'd say that datasheet has some kind of problem. Probably someone used a ruler to draw the curves.
Take a look at the 6HJ5 datasheet curves below, obviously fake too.
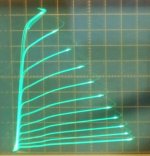
The real 6HJ5 curves on the right:
Someone couldn't be bothered with taking all the real datapoints, they just put a ruler across.
Take a look at the 6HJ5 datasheet curves below, obviously fake too.
The real 6HJ5 curves on the right:
Someone couldn't be bothered with taking all the real datapoints, they just put a ruler across.
Attachments
Last edited:
Usually the data sheets are "prettied up" somewhat if not accurate. Leaving out screen grid current dips for example.
RCA data sheets (and anyone's sheets who copied them, like GE's 6CB6A) seem to often have poor quality curves. Some of them are even worse than the tube though! Like the 6LZ6 below for Vg2 curves. (too big a gap between 75 Vg2 and 100 Vg2, some of the knees look fake too)
Or Sylvania's 6LR6 datasheet. That one has got a 160 Vg2 curve, instead of the 150 Vg2 that should be there (but still labeled 150 Vg2).
Many others around with ruler flat curves. You can even see the mis-aligned joint between the ruler section and the French-Curved section on some.
http://tubedata.milbert.com/sheets/049/6/6LZ6.pdf
Trust but Verify. I'll believe the curve tracer of course.
Of course there is considerable production variation across tubes of a given type. And across manufacturers. Especially grid alignment accuracy affecting screen grid current dips in the plate curves.
Last edited:
117L7 Spice Model - Ayumi Method
Here is my first real try at an Ayumi model.
I measured the triode characteristics, inter-element capacitances, and then used Ayumi's R based algorithm to produce a spice (LTSpice) model.
Please note that I used only ONE (1) 117L7 for this spice model, I used a LTSpice "curve tracer" circuit setup to test my LTSpice code. The results were close to the published pentode model by TUNG-SOL.
The attached files are need to be changed to the correct file type to be used.
117L7.txt should be renamed to 117L7.sub to work as a subcircuit in LTSpice
and
117L7_Model.txt should be renamed to 117L7_Model.xls to be used in Excel.
I have four 117L7 tubes by three different manufacturers. The inter-element capacitance I used was the average of the four. One day I will get around to measuring the triode characteristics of the other three. Hey, it takes time and to measure all that data!
Let me know what you think.
Cheers,
TCH
Attachments
6DN7 LTSpice Model?
Does anyone have or know of an LTSpice model for the 6DN7 dissimilar dual triode?
I found this Spice library, which has a model for both halves, but would have to figure out how to convert it to LTSpice format.
http://home.netcom.com/~aa5/tubes/spice3.txt
Thanks,
Jeff
Does anyone have or know of an LTSpice model for the 6DN7 dissimilar dual triode?
I found this Spice library, which has a model for both halves, but would have to figure out how to convert it to LTSpice format.
http://home.netcom.com/~aa5/tubes/spice3.txt
Thanks,
Jeff
Download and save the file as tubes.lib as you can see it's- Andrei's tube models library (for Spice 3f4), to convert to LTSpice replace all "^" with "**".
Note that there are 6DN7-1 and 6DN7-2. You can also cut and paste this model only and replace the "^" with "**" with Notepad, use spice directive "S" to paste the text, the following lines I already replace the "^", you have to do it yourself if the browser text got errors:
.subckt 6DN7-1 P G K
* Modified Koren model (8 parameters): mean fit error 0.101344 mA
Bp P K I=(0.02750475409m)*uramp(V(P,K)*ln(1.0+(-0.2220541487)+exp((6.476133744)+(6.476133744)*((20.79769842)+(-57.47555304m)*V(G,K))*V(G,K)/sqrt((48.78025652)**2+(V(P,K)-(14.11317325))**2)))/(6.476133744))**(1.291448834)
.end 6DN7-1
Yes, some of the datasheets leave much to be desired, especially for the less common tubes.
Existing Ayumi model did trace very well with actual circuit that is based on original datasheet.
While I manage to get a gain of 38 using plate resistor 38k and Rk 50 ohms bypassed. With the same value using Smoke-amp triode plot it's 50.
So best is to see if there more result of actual circuits coming up.
Great job!Here is my first real try at an Ayumi model.
Download and save the file as tubes.lib as you can see it's- Andrei's tube models library (for Spice 3f4), to convert to LTSpice replace all "^" with "**".
Thanks! I knew there was a copy-paste fix but couldn't find it. In TextWrangler (on a Mac) I copy-pasted the 6DN7 sections out of the .lib file into a single 6DN7.inc file, did the find and replace, and now the LTSpice model works like a charm.
Pasting here for anyone who may be searching in the future. Copy-paste the code below into a plain-text file and save as 6DN7.inc. In the LTSpice simulation, you'll need to name the tube symbols after the two sections: 6DN7-1 and 6DN7-2.
Code:
* 6DN7  -  IDH medium-mu dissimilar twin Bp  P K  I=(m)*uramp(()*V(G,K)+V(P,K))**1.5
* From Sophia-traced 6DN7 curves - traced on 04-10-01 by AF
.subckt 6DN7-1  P G K
    Cgp G P  4.0p
    Ci  G K  2.2p
    Co  P K  0.7p
* Modified Koren model (8 parameters): mean fit error 0.101344 mA
    Bp  P K  I=(0.02750475409m)*uramp(V(P,K)*ln(1.0+(-0.2220541487)+exp((6.476133744)+(6.476133744)*((20.79769842)+(-57.47555304m)*V(G,K))*V(G,K)/sqrt((48.78025652)**2+(V(P,K)-(14.11317325))**2)))/(6.476133744))**(1.291448834)
.ends 6DN7-1

.subckt 6DN7-2  P G K
    Cgp G P  5.5p
    Ci  G K  4.6p
    Co  P K  1.0p
* Modified Koren model (8 parameters): mean fit error 0.218544 mA
    Bp  P K  I=(0.4296657076m)*uramp(V(P,K)*ln(1.0+(-0.04427954871)+exp((5.572446012)+(5.572446012)*((19.67951777)+(9.426242747m)*V(G,K))*V(G,K)/sqrt((27.29499534)**2+(V(P,K)-(1.761721512))**2)))/(5.572446012))**(1.154878347)
.ends 6DN7-2
Last edited by a moderator:
The mu is around 116 from the above model, compared to Bench's 140. Still curious why there is still such large difference between the tubes...Based on the above 6gu5 triode trace I'am able to trace triode model: <snip>
"In triode connection it has high gm (16mS), very high mu (140) and low plate resistance (9k)." from here.
The following is copy from Steve schematic, but since it has unbpassed Rk, the stage gain is then never equal to 140. Not sure what actual plate and cathode current as it's not leveled.
Mu 140 refers the following data which is operating points we want to verify against, not his schematic Vg=0.92V.
In my schematic it's probable that Mu is very close to stage gain since SIM value is quite close.
6GU5 Triode Mode Characteristics:
Va = 200V, Vg = -0.75V, Ia = 10mA
gm = 16mS
ra = 9k
mu = 140
Cga = 0.5pF
That's the whole point, Bench's triode model is quite different from yours... In his sim, the stage's gain is "slightly over 100" - so a 40% difference from yours. No matter how you look at it, the two SPICE models as well as the triode curves that were used to generate them are not in agreement. All this is made worse because there isn't really that much data given for the 6GU5.
The 6GU5 tube is a remote-cutoff grid1. The triode Mu will be all over the place depending on the operating point chosen.
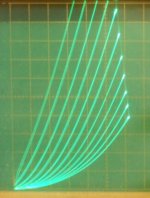
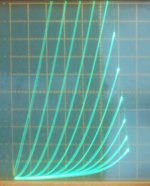
1st Pic. 6GU5 in triode:
(50 V/div Horiz., 2 mA/div Vert., -0.2V grid1 steps)
Going across the 6 mA horiz. line, looks like Mu from 150 to 100 range. A sloped load line might drop down into 150 to 75 Mu range.
2nd Pic. 6EW6 in triode
(50V/div Horiz., 2 mA/div Vert., -0.4V grid1 steps) Mu around 100 to75
Attachments
Last edited:
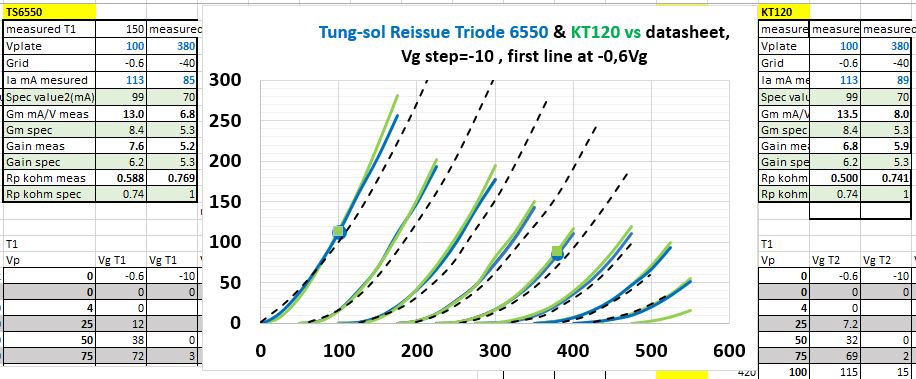
I got myself a tube tester where I can get data to plot plate curves.
Here is a comparison between Tung-sol reissue 6550, TS reissue KT120 and the Ge 6550A datasheet curves. http://www.mif.pg.gda.pl/homepages/frank/sheets/135/6/6550A.pdf
Lt Spice code
* pentvacKT120 LTSpice model
* Modified Koren model (8 parameters):
* Traced by erik 25/12/2013 using Curve Captor v0.9.1
* from PENTAVAC TESTER
* pentvacKT120 LTSpice model
.subckt pentvacKT120 P G K
Bp P K I=(0.08338166036m)*uramp(V(P,K)*ln(1.0+(-0.1831999916)+exp((1.646266789)+(1.646266789)*((11.7226991)+(-8.34911339m)*V(G,K))*V(G,K)/sqrt((6.285909292e-008)**2+(V(P,K)-(-1.963839006))**2)))/(1.646266789))**(1.556388807)
Cgk G K 10.2p ; 0.2p added
Cpk P K 9.3p ; 0.5p added
Cgp G P 29.5p ; 0.5p added
Rpk P K 1G ; to avoid floating nodes
d3 G K dx1
.model dx1 d(is=1n rs=2k cjo=1pf N=1.5 tt=1n)
.ends pentvacKT120
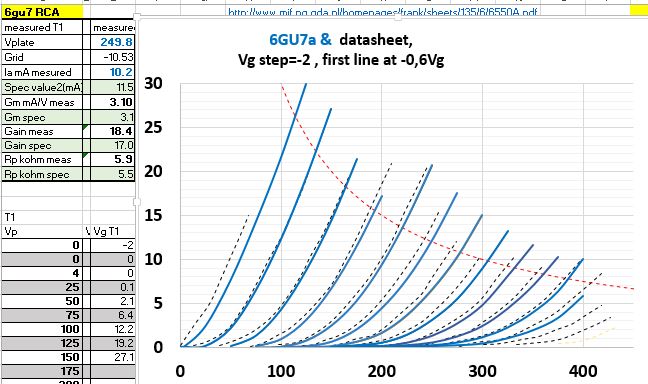
My secret weapon is the 6GU7
* penta6GU7 LTSpice model
* Modified Koren model (8 parameters):
* Traced by erik 25/12/2013 using Curve Captor v0.9.1
* from PENTAVAC TESTER
* penta6GU7 LTSpice model
.subckt penta6GU7 P G K
Bp P K I=(0.06530968005m)*uramp(V(P,K)*ln(1.0+(-0.05276936784)+exp((2.050356028)+(2.050356028)*((29.00542735)+(-88.26359513m)*V(G,K))*V(G,K)/sqrt((30.90804259)**2+(V(P,K)-(3.024929248))**2)))/(2.050356028))**(1.285895446)
Cgk G K 0.6p ; 0.2p added
Cpk P K 3.9p ; 0.5p added
Cgp G P 3.5p ; 0.5p added
Rpk P K 1G ; to avoid floating nodes
d3 G K dx1
.model dx1 d(is=1n rs=2k cjo=1pf N=1.5 tt=1n)
.ends penta6GU7
* penta6GU7 LTSpice model
* Modified Koren model (8 parameters):
* Traced by erik 25/12/2013 using Curve Captor v0.9.1
* from PENTAVAC TESTER
* penta6GU7 LTSpice model
.subckt penta6GU7 P G K
Bp P K I=(0.06530968005m)*uramp(V(P,K)*ln(1.0+(-0.05276936784)+exp((2.050356028)+(2.050356028)*((29.00542735)+(-88.26359513m)*V(G,K))*V(G,K)/sqrt((30.90804259)**2+(V(P,K)-(3.024929248))**2)))/(2.050356028))**(1.285895446)
Cgk G K 0.6p ; 0.2p added
Cpk P K 3.9p ; 0.5p added
Cgp G P 3.5p ; 0.5p added
Rpk P K 1G ; to avoid floating nodes
d3 G K dx1
.model dx1 d(is=1n rs=2k cjo=1pf N=1.5 tt=1n)
.ends penta6GU7
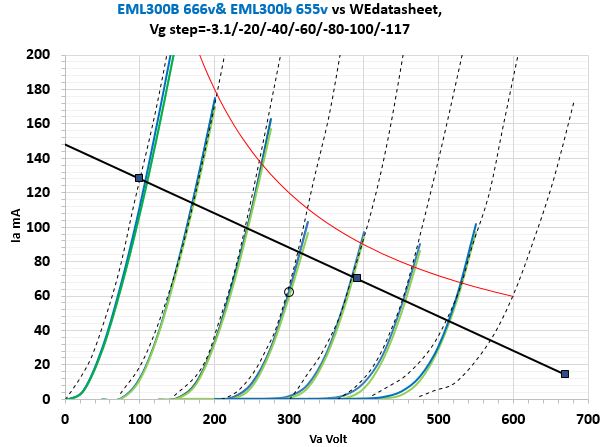
My pair of Emission Labs 300B compared with Western Electric 300B datasheet curves
And thespice model.
* TML300b LTSpice model corrected by 1/2 heater volt
* Modified Koren model (8 parameters): mean fit error 0,8mA
* Traced by erik 25/12/2013 using Curve Captor v0.9.1
* pentaTJ300B LTSpice model
* pentaEML300b LTSpice model
.subckt pentaEML300b P G K
Bp P K I=(0.1471360425m)*uramp(V(P,K)*ln(1.0+(-0.0836812242)+exp((14.77238937)+(14.77238937)*((4.010010839)+(0.03955144628m)*V(G,K))*V(G,K)/sqrt((2.786333203e-006)**2+(V(P,K)-(2.303526987))**2)))/(14.77238937))**(1.48386058)
Cgk G K 8.5p ; 0.2p added
Cpk P K 4.6p ; 0.5p added
Cgp G P 15.5p ; 0.5p added
Rpk P K 1G ; to avoid floating nodes
d3 G K dx1
.model dx1 d(is=1n rs=2k cjo=1pf N=1.5 tt=1n)
.ends pentaEML300b
- Home
- Amplifiers
- Tubes / Valves
- Vacuum Tube SPICE Models