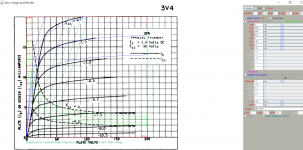
Here is a quick way to get triode model from pentode screen shot datasheet. The triode cruve will then use as input to build the pentode model. The two images can then be merged into one image for paint tool. The triode curve is compared to triode strapped curve in paint tool until a suitable pentode is obtained. I hope you find it useful if you don't already know this, it cuts down lot of time taken to verify the model.
Attachments
Hi Koonw, I´m interested in plot triode curves from pentodes ones. I barely know how to trace pentode curves on Model Paint Tools but don´t know how to set them up to make triode curves on LT Spice, can you help me? Thanks!!!!
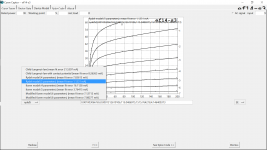
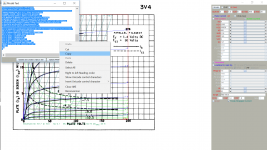
6) After you have generated the model in paint tool, copy the model to Spice directive (press S) to paste the model text. Open a pentode asy that has the net/pin order same as the model. To get triode plot, G2 is connected directly to the Plate, then use run .dc, in waveform windows, "Add Trace" as
Ix(U1:Anode)+ Ix(U1:G2)
set .dc direct for plate 0-260 1v step and Vg 0 to -8, 1v step:
.dc Va 0 260 1 Vg 0 -8 1
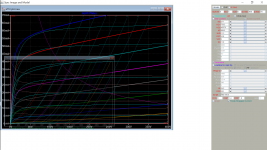
Run dc sweep sim, then adjust Manual Limits of the Va and Ip.
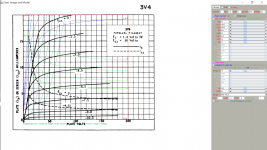
Before you can plot a more accurate triode model from pentode curve, it required the screen G2 current. Attached is the procedure to achieve better result.
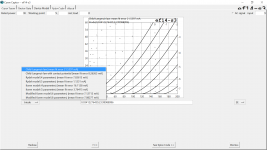
1) set up Eg steps, max Ea, Ia, and and Eg2. Set up Eg steps equal to Eg2 current, you can expand later to full steps. Set VCT=0
2) Align the Screen G2 current using KG2, KV2 and EX so that is closely match the G2 current curve in datasheet.
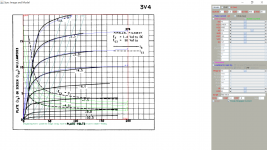
3) Adjust KP, KG1 so that the plot match with the Ia/Ea curve.
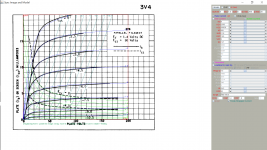
4) Expand Eg to full step, adjust Mu, KG1 such entire plot match with Ia/Ea curve.
5) Click "Model" to generate and copy and paste to Spice.
Attachments
- Status
- This old topic is closed. If you want to reopen this topic, contact a moderator using the "Report Post" button.