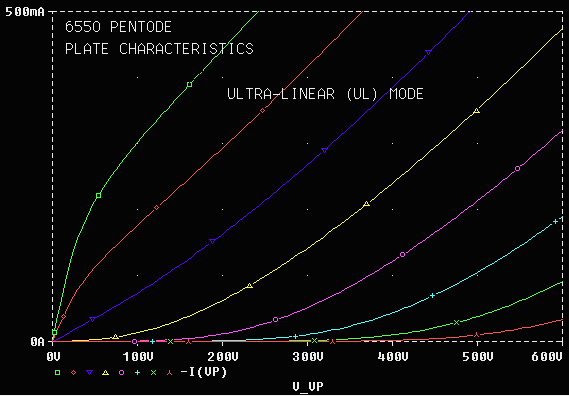
Could you please post the 6550A Spice model? I could not get Ayumi's version to work properly.😡 So in the above graph, are the SOAs set to intercept with the load lines (instead of the datasheet 42W spec)? Also, for Class A, the operating conditions are different, so another graph is needed.
I redrew the chart and changed the operating anode voltages to those shown in the data sheet. in the previous example i had an error and was using 3400R -- should have been 4000R and the slope was too high.
EDIT -- the chart above uses the data from the PDF, not those approximated with SPICE.
Amplification Factor 8.603 MU
kp 34.89 kp
Exponent 1.543 EX
Knee 11.947 KVB
Perveance 1995.1 KG
The parameters will change depending upon the limits you attach to the variables and the type of error you minimize.
EDIT -- the chart above uses the data from the PDF, not those approximated with SPICE.
An externally hosted image should be here but it was not working when we last tested it.
Amplification Factor 8.603 MU
kp 34.89 kp
Exponent 1.543 EX
Knee 11.947 KVB
Perveance 1995.1 KG
The parameters will change depending upon the limits you attach to the variables and the type of error you minimize.
Last edited:
Thanks for the Koren parameters for the 6550A. Also, so it appears that it is still not possible to get the knees to line up on the 6V6 even with Robert's code, a real tough cookie...
Which of the data-sheets has the UL curves for the 6V6? It's not on GE or Tungsol.
BTW, it would appear that you can do any of the ZL curves with a transformer -- just change Zs from the nominal 8 ohms. The biggest I have is a 25W from Edcor -- as the UTracer pulses the anode and plate voltages, perhaps it will stand up to the demands.
BTW, it would appear that you can do any of the ZL curves with a transformer -- just change Zs from the nominal 8 ohms. The biggest I have is a 25W from Edcor -- as the UTracer pulses the anode and plate voltages, perhaps it will stand up to the demands.
I can not find any UL curve for the 6V6, other than those plotted with the SPICE models. You mean the UL curve could be traced by varying the output load using a conventional (non-UL) transformer?
I can not find any UL curve for the 6V6, other than those plotted with the SPICE models. You mean the UL curve could be traced by varying the output load using a conventional (non-UL) transformer?
If the transformer were center-tapped you could change the Screen UL factor to 50%.
I'm still working through this.
I have 2 6V6's but they both test "weak" -- their pentode curves don't remotely match those of the datasheet. Not much point trying to derive UL Params with them.
As close as it gets, here is an UL characteristic for the Russian 6P6S:
An externally hosted image should be here but it was not working when we last tested it.
An externally hosted image should be here but it was not working when we last tested it.
Params: MU=11.19 KP=37.5 EX=1.5 KVB=8.0 KG1=3430
6P6C
Params: MU=11.19 KP=37.5 EX=1.5 KVB=8.0 KG1=3430
I redrew the chart and changed the operating anode voltages to those shown in the data sheet. in the previous example i had an error and was using 3400R -- should have been 4000R and the slope was too high.
EDIT -- the chart above uses the data from the PDF, not those approximated with SPICE.
Amplification Factor 8.603 MU
kp 34.89 kp
Exponent 1.543 EX
Knee 11.947 KVB
Perveance 1995.1 KG
The parameters will change depending upon the limits you attach to the variables and the type of error you minimize.
Just to clarify, the above models are customized for UL operation and should not be used for normal pentode operation, right?
Dumb question, how do you plot UL characteristic in LTSpice?
A transformer model probably won't help since you're plotting the DC Transfer Characteristic -- It's probably more instructive to capture the data from the data sheet and plot the load line. From the load line you can make calculations of THD%
I'd be happier if the models were better grounded in the physics...
Enough jabbering, here's some load lines from what I gleaned from the Russian data sheet. It appears that they pivot around 300V, -15V and 45mA.
An externally hosted image should be here but it was not working when we last tested it.
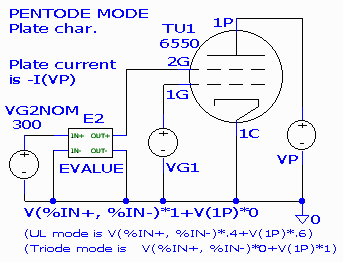
Plotting UL characteristic with SPICE, is easier than I thought, this is the basic setup from Norm Koren.

The GE datasheet does not have the Eg2 at 300V, so I am puzzled why Mr. Koren said the following in his article.
Pentode, triode, and UL mode plots for the GE 6550A are shown below. The 6550A data sheet is available from Frank's electron tube pages. It's gratifying to see the excellent agreement with data in all three modes.
Here is the 6550 UL characteristic from Koren's article, it very different from the one in the GE datasheet, so what gives?!

Last edited:
UL Simulator in Multisim:
Results:
An externally hosted image should be here but it was not working when we last tested it.
Results:
An externally hosted image should be here but it was not working when we last tested it.
An externally hosted image should be here but it was not working when we last tested it.
An externally hosted image should be here but it was not working when we last tested it.
Last edited:
Just a follow-on to my post #54, so it turned out Koren's UL characteristic has Eg2=450V not 300V as I thought, in any case, the model looks nothing like the datasheet, so for him to say that "It's gratifying to see the excellent agreement with data in all three modes." was just nonsense. Wonder why no one bothered to challenge his claim when the article was posted back then...
Koren 6550A UL model vs. the GE datasheet:
Koren 6550A pentode model vs. the GE datasheet:
Koren 6550A UL model vs. the GE datasheet:
An externally hosted image should be here but it was not working when we last tested it.
Koren 6550A pentode model vs. the GE datasheet:
An externally hosted image should be here but it was not working when we last tested it.
Last edited:
SPICE Models - EC88 & EC8010
http://www.diyaudio.com/forums/software-tools/224965-ltspice-tube-models-3.html#post3679855
http://www.diyaudio.com/forums/software-tools/224965-ltspice-tube-models-3.html#post3679855
C3m spice model
Guys,
please check this model for C3M based on Telefunken data.
I made it for my personal use using a formulas from the net and final tuning with LT spice.
Thanks.
* C3M PENTODE; Telefunken data*
* Ug2=150V
* E74GD 18.7.2012.
.SUBCKT C3m 1 4 2 3 ; A K G2 G1;
+ PARAMS: MU= 19.99 EX= 1.233 KG1= 655.0 KP=115 KG2= 1400
+ KVB= 15.8 VCT= 0.00 RGI=220
+ CCG=9P CPG1=0.1P CCP=7P
RE1 7 0 1G
RE2 8 3 1G
E1 7 0 VALUE= ; E1 BREAKS UP LONG EQUATION FOR G1.
+{V(4,3)/KP*LOG(1+EXP((1/MU+V(2,3)/V(4,3))*KP))}
G1 1 3 VALUE={(PWR(V(7),EX)+PWRS(V(7),EX))/KG1*ATAN(V(1,3)/KVB)}
G2 8 3 VALUE={(PWR(V(7),EX)+PWRS(V(7),EX))/KG2*(2.5708-ATAN(V(1,3)/KVB))}
E2 8 4 VALUE={0}
RCP 1 3 1G ; FOR CONVERGENCE
C1 2 3 {CCG} ; CATHODE-GRID 1
C2 1 2 {CPG1} ; GRID 1-PLATE
C3 1 3 {CCP} ; CATHODE-PLATE
R1 2 5 {RGI} ; FOR GRID CURRENT
D3 5 3 DX ; FOR GRID CURRENT
.MODEL DX D(IS=1N RS=1 CJO=10PF TT=1N)
.ENDS
Attachments
Guys,
please check this model for C3M based on Telefunken data.
I put the model into my Excel spreadsheet -- seems to be a bit better than the "naive" model which Solver generates.
An externally hosted image should be here but it was not working when we last tested it.
- Home
- Amplifiers
- Tubes / Valves
- Vacuum Tube SPICE Models

