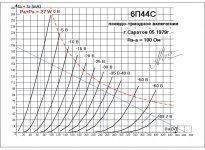
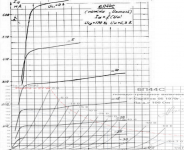
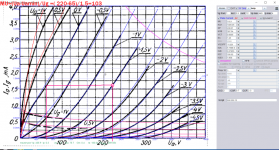
There is a 6p44c triode connected curve here:
Кабинетный SE на 6П44С
You need an account to retrieve it. This will help a lot, you use paint.net to make an curve image with pentode and triode overlapping and in Paint tool turn on triode connected mode to adjust against the triode curve of the image.
Кабинетный SE на 6П44С
You need an account to retrieve it. This will help a lot, you use paint.net to make an curve image with pentode and triode overlapping and in Paint tool turn on triode connected mode to adjust against the triode curve of the image.
Attachments
Last edited:
Vacuum Tube SPICE ModelsI can't find the model of 6gk5 here. Who has provided it. thank you
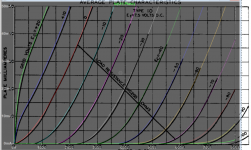
https://frank.pocnet.net/sheets/029/2/24A.pdfDoes anyone have data for UY-224 or 24A? Thank you.
Please test this model if interested, see how it goes.
Code:
**** 24A ******************************************
* Created on 05/28/2020 17:38 using paint_kip.jar
* [url=http://www.dmitrynizh.com/tubeparams_image.htm]Model Paint Tools: Trace Tube Parameters over Plate Curves, Interactively[/url]
* Plate Curves image file: 24a.png
* Data source link: [url]https://frank.pocnet.net/sheets/029/2/24A.pdf[/url]
*----------------------------------------------------------------------------------
.SUBCKT 24A P G2 G K ; LTSpice tetrode.asy pinout
* .SUBCKT 24A P G K G2 ; Koren Pentode Pspice pinout
+ PARAMS: MU=580 KG1=2309.12 KP=51.02 KVB=2.4 VCT=4.512 EX=1.008 KG2=2436 KNEE=53.76 KVC=1.748
+ KLAM=3.68E-7 KLAMG=7.02E-4  KD=0.3692 KC=0.1694 KR1=0.001092 KR2=0.03904 KVBG=0.000937 KB1=0.98 KB2=3.9 KB3=0.003867 KB4=104.32 KVBGI=0.3891 KNK=-0.044 KNG=0.006
+ CCG=5P CGP=0.01P CCP=10P RGI=2000.0
* Vp_MAX=560 Ip_MAX=10 Vg_step=1.5 Vg_start=0 Vg_count=6
* X_MIN=155 Y_MIN=289 X_SIZE=1010 Y_SIZE=511 FSZ_X=1653 FSZ_Y=995 XYGrid=true
* Rp=1400 Vg_ac=20 P_max=3 Vg_qui=-3.75 Vp_qui=300
* showLoadLine=n showIp=y isDHP=n isPP=n isAsymPP=n isUL=n showDissipLimit=y
* showIg1=n isInputSnapped=y addLocalNFB=n
* XYProjections=n harmonicPlot=y dissipPlot=n
* UL=0.43 EG2=90 gridLevel2=n addKink=n isTanhKnee=n advSigmoid=y
*----------------------------------------------------------------------------------
RE1  7 0  1G    ; DUMMY SO NODE 7 HAS 2 CONNECTIONS
E1   7 0  VALUE=  ; E1 BREAKS UP LONG EQUATION FOR G1.
+{V(G2,K)/KP*LOG(1+EXP((1/MU+(VCT+V(G,K))/SQRT(KVB+V(G2,K)*V(G2,K)))*KP))}
RE2  6 0  1G    ; DUMMY SO NODE 6 HAS 2 CONNECTIONS
E2  6 0  VALUE={(PWR(V(7),EX)+PWRS(V(7),EX))} ; Kg1 times KIT current
E4   8 0  VALUE={V(P,K)/KNEE/(KVBGI+V(6)*KVBG)}
E5  81 0  VALUE={PWR(V(8),KB1)}
E6  82 0  VALUE={PWR(V(8),KB2)}
E7  83 0  VALUE={PWR(V(8),KB3)}
E8   9 0  VALUE={PWR(1-EXP(-V(81)*(KC+KR1*V(82))/(KD+KR2*V(83))),KB4)*1.5708}
RE4  8 0  1
RE5 81 0  1
RE6 82 0  1
RE7 83 0  1
RE8  9 0  1
G1   P K  VALUE={V(6)/KG1*V(9)*(1+KLAMG*V(P,K))+KLAM*V(P,K)}
G2   G2 K  VALUE={V(6)/KG2*(KVC-V(9))/(1+KLAMG*V(P,K))}
RCP  P K  1G     ; FOR CONVERGENCE
C1   K G  {CCG}  ; CATHODE-GRID 1
C2   G P  {CGP}  ; GRID 1-PLATE
C3   K P  {CCP}  ; CATHODE-PLATE
R1   G 5  {RGI}  ; FOR GRID CURRENT
D3   5 K  DX     ; FOR GRID CURRENT }
.MODEL DX D(IS=1N RS=1 CJO=10PF TT=1N)
.ENDS
*$
Attachments
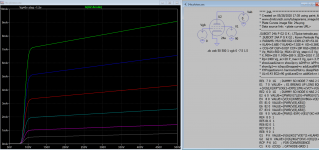
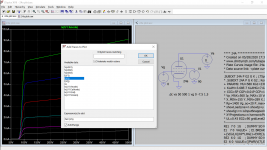
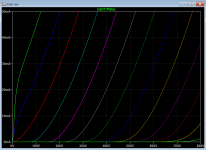
Use dc sweep simulation, e.g .dc Va 0 500 1 vV 0 -8 -1 run it. Right click in the waveform window, click Add Trace in popup windows pick the data or enter expression. For dissipation it is PdMax/Va. If PdMax is 3w then expression is 3w/Va, where Va is the data display in data available. Right click the waveform window, click View->Manual Limits to set display limit, if not display correctly.Koonw,
How do you generate the plate dissipation curves in LTspice? I replicated the diagram in the thumbnail picture (post #2405) but failed to produce the curves. How do I generate "lx(U2:anode)"?
Thanks,
Jeff
Attachments
Last edited:
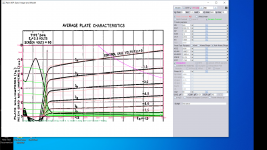
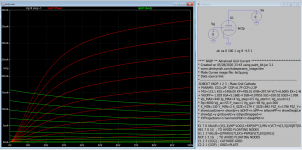
Here is the model with grid current based on original curve found on left bottom corner.Can somebody here make a precise model of 6N2P and 6N2P-EV .....sorry for give work to do.....
Code:
**** 6N2P ** Advanced Grid Current **********************************
* Created on 05/28/2020 23:43 using paint_kit.jar 3.1
* [URL="http://www.dmitrynizh.com/tubeparams_image.htm"]Model Paint Tools: Trace Tube Parameters over Plate Curves, Interactively[/URL]
* Plate Curves image file: 6n2p.png
* Data source link:
*----------------------------------------------------------------------------------
.SUBCKT 6N2P 1 2 3 ; Plate Grid Cathode
+ PARAMS: CCG=2P  CGP=0.7P CCP=2.3P
+ MU=115.1 KG1=1406.05 KP=438.01 KVB=397.54 VCT=0.6005 EX=1.46
+ VGOFF=-1.029 IGA=5.168E-4 IGB=0.07855 IGC=100.02 IGEX=1.958
* Vp_MAX=440 Ip_MAX=4 Vg_step=0.5 Vg_start=1 Vg_count=12
* Rp=4000 Vg_ac=55 P_max=1 Vg_qui=-48 Vp_qui=300
* X_MIN=130 Y_MIN=3 X_SIZE=1179 Y_SIZE=842 FSZ_X=1798 FSZ_Y=965 XYGrid=true
* showLoadLine=n showIp=y isDHT=n isPP=n isAsymPP=n showDissipLimit=y
* showIg1=y gridLevel2=y isInputSnapped=n
* XYProjections=n harmonicPlot=n dissipPlot=n
*----------------------------------------------------------------------------------
E1 7 0 VALUE={V(1,3)/KP*LOG(1+EXP(KP*(1/MU+(VCT+V(2,3))/SQRT(KVB+V(1,3)*V(1,3)))))}
RE1 7 0 1G  ; TO AVOID FLOATING NODES
G1 1 3 VALUE={(PWR(V(7),EX)+PWRS(V(7),EX))/KG1}
RCP 1 3 1G   ; TO AVOID FLOATING NODES
C1 2 3 {CCG} ; CATHODE-GRID
C2 2 1 {CGP} ; GRID=PLATE
C3 1 3 {CCP} ; CATHODE-PLATE
RE2 2 0 1G
EGC 8 0 VALUE={V(2,3)-VGOFF} ; POSITIVE GRID THRESHOLD
GG 2 3 VALUE={(IGA+IGB/(IGC+V(1,3)))*(MU/KG1)*(PWR(V(8),IGEX)+PWRS(V(8),IGEX))}
.ENDS
*$
Attachments
Koonw,
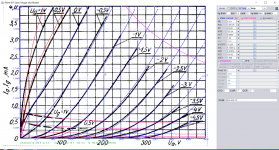
From 6N2P curves you posted here, MU is about 103.
NOT 116 as in your spice model. Sorry, but your spice model is unusable.
Dimitrij has an extraordinary tool for making spice models. You just need to be a little more careful when applying.
Best diying
From 6N2P curves you posted here, MU is about 103.
NOT 116 as in your spice model. Sorry, but your spice model is unusable.
Dimitrij has an extraordinary tool for making spice models. You just need to be a little more careful when applying.
Best diying
Attachments
Last edited:
Thank for you advice. The u here is for best fit, because 6n2p is less linear towards the right extreme, the increase of u give it better fit. I also done 2 other 12ax7 Mazda and Philips the u is both 100 fit nicely. I tried a mu 60 for 12AT7, the best fit is 94, what say you ah?? That is if you point the mouse on screen, mu of all over the places there is no need to calculate like you did!. A small change cause big drift that is where one have to be judicial in making the choice. Anyhow the Mu is in the model does not matter a lot, for example a mu of 94 the gain is only slightly higher if model with mu of 60 for 12AT7, I can show u later why I begin to dislike the paint_kit.jar, but I like pentode paint_kip, it has more than 8 parameters! As long as you get best fit, it does not stick to fix parameters these are design to fit a wider ranges of curve.Koonw,
From 6N2P curves you posted here, MU is about 103.
NOT 116 as in your spice model.
Dimitrij has an extraordinary tool for making spice models. You just need to be a little more careful when applying.
Best diying
Sorry, but your spice model is unusable.
This is a bit harsh.
I doubt anyone will seriously want to run this valve at a range of +1v grid through to -4v grid at the same time and expect a linear result.
In this case, the curves are a very good match where grid voltage is minus 1 to 1.5 volts and at 0 volts above 2mA.
If you more sensibly bias your 6n2p where it is more linear, at 240v and 3mA, then mu is most certainly far higher than 103 and you avoid dealing with the 0v grid bias where there is an inflection in the grid curve - which is where you chose to measure your mu.
Feel free to post a better match.
kind regards
Marek
I assume that 6N2P model is most commonly used to simulate E. Dutman modified RCA RIAA preamp.
I used nl3prc spice model and it is quite correct in practically finished DIY preamp. No need to do my own spice model.
RIAA preamp is certainly the most sensitive part of our DIY.
If the model is not good ....
I used nl3prc spice model and it is quite correct in practically finished DIY preamp. No need to do my own spice model.
RIAA preamp is certainly the most sensitive part of our DIY.
If the model is not good ....
I assume that 6N2P model is most commonly used to simulate E. Dutman modified RCA RIAA preamp.
I used nl3prc spice model and it is quite correct in practically finished DIY preamp. No need to do my own spice model.
RIAA preamp is certainly the most sensitive part of our DIY.
If the model is not good ....
Ya, the model you quoted is old Koren's model, Paint Tool use Modified Koren model, I For E. Dutman's work FYI it works with any 12ax7 or 6n2p or 6n2 model when grid current is not modeled (or included) because the Zin for such model is extreme high (10G) and Eli tweaked timing component which actual presented Z is still near 20M when //10G.
I hope you understand why you have being successful because it works with the sim but that is not all to it. I hope you enjoy listening to your music.
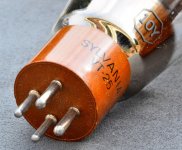
Hi, people do I miss the VT-25A model or is it really in the wanted board?
LTSPICE problems with 10Y model
https://frank.pocnet.net/sheets/021/1/10.pdf
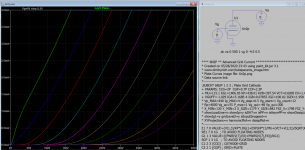
This post #2 model (copy code as below) fitted well with 10y-RCA. No grid current modeled.
Code:
.SUBCKT 10Y 1 2 3; A G C
+params: MU=8.07 EX=1.571 KG1=5297.4 KP=141 KVB=111 RGI=2000
+ CCG=3.0P CGP=7.0P CCP=4.0P
E1 7 0 VALUE=
+{V(1,3)/KP*LOG(1+EXP(KP*(1/MU+V(2,3)/SQRT(KVB+V(1,3)*V(1,3)))))}
RE1 7 0 1G
G1 1 3 VALUE={0.5*(PWR(V(7),EX)+PWRS(V(7),EX))/KG1}
RCP 1 3 1G ; TO AVOID FLOATING NODES IN MU-FOLLOWER
C1 2 3 {CCG} ; CATHODE-GRID
C2 2 1 {CGP} ; GRID-PLATE
C3 1 3 {CCP} ; CATHODE-PLATE
D3 5 3 DX ; FOR GRID CURRENT
R1 2 5 {RGI} ; FOR GRID CURRENT
.MODEL DX D(IS=1N RS=1 CJO=10PF TT=1N)
 .ENDS
Also read this: Portrait of a tube. VT25, VT25A, 10, 10Y
Attachments
Last edited:
- Home
- Amplifiers
- Tubes / Valves
- Vacuum Tube SPICE Models