Tracer first test
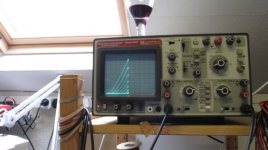
After a lot of work (more than I thought it was going to take), managed to bring the valve curve tracer to life.
Never thought I'd ended up wiring and soldering so many cables! Anyway, it gave me some headaches with the phase adjusting RC stage. It worked brilliantly on the breadboard, but now it seems not to be sufficient level of correction. I used same Pot=100K (10T) and C=50nF. When I drive down (or up?) the pot all the way through can't move the retracing down to the bottom of the curves, so probably need to increase R but adding a series resistor or perhaps reducing the capacitance? I guess need to try and see what happens...
Other minor hiccup was the neon lamp. It's a classic russian IN-1, and wired to the +80V with a 30K resistor I think to enable 0.5mA for an operating voltage of 65V as read on the specs. It worked for some time but then it went dead. Any idea what can be?
Well, couldn't resist the afternoon and had some red wine whilst playing with the tester....
Cheers,
Ale
Attachments
It's a beauty! Congratulations.
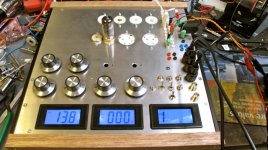
The wiring and the soldering was also more than I expected! I need to buy new meters that fit without doing more modification work. Currently I am trying to play with "shunt, schade, parallel" feedback. Not really sure what the best setup is. I will post some pictures later.
Once everything is complete I will post the as-built circuit.
Alfredo
Tracing parallel feedback curves
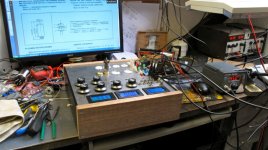
I want to properly trace parallel feedback curves but I am not sure if what I am doing is correct. Can somebody validate that my setup is acceptable? It appears I am getting good curves.
Thanks
Alfredo
I want to properly trace parallel feedback curves but I am not sure if what I am doing is correct. Can somebody validate that my setup is acceptable? It appears I am getting good curves.
Thanks
Alfredo
Attachments
-
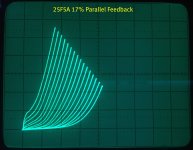 IMAGE_25C3BF86-F1B6-42F1-8951-004.JPG354.8 KB · Views: 99
 -
 IMAGE_C76C052E-4BB7-4515-99A9-64258CE36C3A-001.JPG290 KB · Views: 86
 -
 IMAGE_F99FD275-E250-497C-944F-ABE1E26C3EEB-001.JPG412.2 KB · Views: 89
 -
 IMAGE_A9810748-92E2-429B-9854-A925D9FE178C-001.JPG397.2 KB · Views: 88
 -
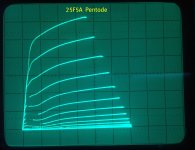 IMAGE_2CB94156-3AAD-4F69-984E-005.JPG386.9 KB · Views: 269
 -
 Parallel Feedback curve connection.jpg5.3 KB · Views: 278
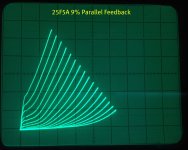
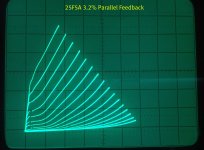
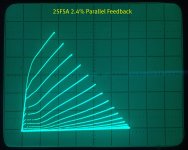
I want to properly trace parallel feedback curves but I am not sure if what I am doing is correct. Can somebody validate that my setup is acceptable? It appears I am getting good curves.
Thanks
Alfredo
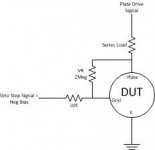
I can't explain the big tetrode-triode transition. That's not the way I think about it's in-circuit behavior.
It would help if you labeled the resistor values for each case and voltages on the plot.
The first thing I wonder about is the series load resistor. What is the purpose of this, the value, and where are you measuring plate voltage?
Are you quoting the voltage divider ratio as the feedback %?
Also there won't be a curve with grid voltage starting at zero because the feedback will pull the grid positive from there. The leftmost curve would have grid voltage =0 at it's top end
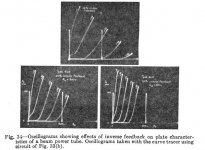
Have you seen the paper by O.H. Schade with his equivalent curves? They actually do have a little of the tetrode-triode switchover on the left end but not so soft on the knees at the bottoms... Maybe you're going more into the +ve grid region for more of the curves?
Attachments
Last edited:
Hi Michael,
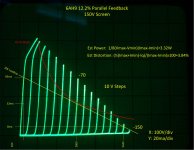
The load resistor is just for current limiting the plate. It sets the slope of the tips in the plots. In this case it is around 1.75K.
Yes, I am quoting the divider ratio as percent feedback. The values of the pot are (grid fixed at 10k)
2.4% 400K
3.2% 300K
9%. 100K
17%. 50K
All traces have a x=50 v/div. y=20 ma/div
Leftmost curve: yes you are correct the zero curve gets squashed by the positive grid current. I moved the bias down to eliminate it.
I have some 6l6, I will hook one up to see if I get similar curves to the schade ones.
6l6GC with Parallel feedback
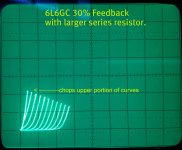
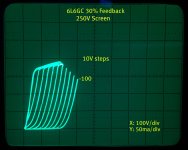
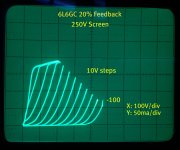
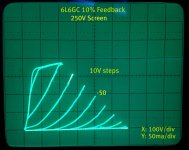
I traced some curves for a 6L6GC. For this one I changed the grid resistor to 100K to achieve the divider ratio easier.
I ran the screen at 250V. Can't determine what voltage Schade used, may have been 300V.
My tracer can only do 10V max between steps, Schade used 20V per step.
Overall, I think my traces are not that far off from the Schade ones.
I did not play with the negative bias this time, so the cutoff is visible. Last picture has a higher series resistor that chops the cutoff visibility off.
The pot resistor values are:
10% : 900K
20% : 400K
30%: 230K
Attachments
Last edited:
I traced some curves for a 6L6GC. For this one I changed the grid resistor to 100K to achieve the divider ratio easier.
I ran the screen at 250V. Can't determine what voltage Schade used, may have been 300V.
My tracer can only do 10V max between steps, Schade used 20V per step.
Overall, I think my traces are not that far off from the Schade ones.
I did not play with the negative bias this time, so the cutoff is visible. Last picture has a higher series resistor that chops the cutoff visibility off.
The pot resistor values are:
10% : 900K
20% : 400K
30%: 230K
Yes, you are getting the same result as Schade, and it's working the way it does in circuit. You could draw a load line.
You've built a nice instrument, congratulations!
Michael
After a lot of work (more than I thought it was going to take), managed to bring the valve curve tracer to life.
Never thought I'd ended up wiring and soldering so many cables! Anyway, it gave me some headaches with the phase adjusting RC stage. It worked brilliantly on the breadboard, but now it seems not to be sufficient level of correction. I used same Pot=100K (10T) and C=50nF. When I drive down (or up?) the pot all the way through can't move the retracing down to the bottom of the curves, so probably need to increase R but adding a series resistor or perhaps reducing the capacitance? I guess need to try and see what happens...
Other minor hiccup was the neon lamp. It's a classic russian IN-1, and wired to the +80V with a 30K resistor I think to enable 0.5mA for an operating voltage of 65V as read on the specs. It worked for some time but then it went dead. Any idea what can be?
Well, couldn't resist the afternoon and had some red wine whilst playing with the tester....
Cheers,
Ale
If greater phase correction is needed, shall I try adding an RC stage before the 100k and 50nF Phase correction circuit?
Any ideas?
Thanks
Ale
If greater phase correction is needed, shall I try adding an RC stage before the 100k and 50nF Phase correction circuit?
Any ideas?
Thanks
Ale
Hi Ale,
Has your DC balance of the AC sine wave changed? This should affect your adjustment range as the edge detection shifts. Mine uses a zero detect comparator so had to inject the common potential into a fake center tap built by using two resistors.
Alfredo
Yes, you are getting the same result as Schade, and it's working the way it does in circuit. You could draw a load line.
You've built a nice instrument, congratulations!
Michael
Thanks Michael,
I have never experimented with parallel feedback in a real amp circuit. Implementing it may be more difficult as in probably will need a DC blocking cap and some FR tuning. I can see that it increases the drive requirements significantly and would add complexity in many cases. I am going to check out a very sensitive TV sweep tube to see what the Parallel feedback does to its drive requirements.
Alfredo
Alfredo
Back in the day, Ed Dell would publish a picture of your handiwork in the back of "The Audio Amateur". Nice work!
Thanks
Hi Ale,
Has your DC balance of the AC sine wave changed? This should affect your adjustment range as the edge detection shifts. Mine uses a zero detect comparator so had to inject the common potential into a fake center tap built by using two resistors.
Alfredo
Hi Alfredo,
No, just changed transformer secondary from 12V to 6V... Shouldn't be this?
Great curves plotted BTW!
Hi Alfredo,
No, just changed transformer secondary from 12V to 6V... Shouldn't be this?
Great curves plotted BTW!
Thanks.
Yes, it could be the culprit as your edge detection window should be narrower now.
Alfredo
$1 Compactron 6AH9
Here is the pentode section of a 6AH9 (sames as 12HL7 in 9 pin). The feedback amount was determined by moving the pot until the 150V grid signal fit within the 600V Plate range. This gave me 717K. Used a 100K grid resistor. Less feedback can be used and the drive requirements are more reasonable and still look like a pretty good triode. Looks good, doesn't it? I think the drive requirement eliminates making a spud out of it. Maybe putting two in parallel and using the two medium mu stages may be enough doubling the power to 6.6 Watts. If using a 12HL7 then any other driver could be used.
I wonder if something like this will ever be stable in the real world...
Alfredo
Attachments
Thanks.
Yes, it could be the culprit as your edge detection window should be narrower now.
Alfredo
Hi Alfredo,
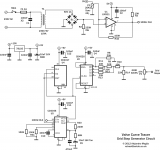
You are probably correct as is the only thing I changed (in addition to final wiring and layout). I stole one 6V winding of my 6V+6V for one of the LCD meters as need to be floating. didn't think I would end up with a limited sync capability. Attached is my current circuit. What is not drawn there is the 100K pot and 50nF RC network between the transformer and the rectifier bridge. I can go back to the 12V winding but will need to think of a workaround for the LCD.....
Actually P1 needs to be set to one of the ends. I suspect it may be better to wire P1 to +15V rather than +5V for a greater pulse width support, but that will require PCB hacking which I want to avoid where possible.
Thoughts?
Attachments
")
- Status
- This old topic is closed. If you want to reopen this topic, contact a moderator using the "Report Post" button.
- Home
- Design & Build
- Equipment & Tools
- DIY Curve Tracer