These are some nice results! My faith in tube amps has been restored. I hope I can achieve such good figures when I build my amplifier design
I think my simulator adds a lot of high order trash due to the inaccuracies of its tube models...
Your FFT plots looked like they were from a square wave - can you post up the output waveform at high power for that?
Your FFT plots looked like they were from a square wave - can you post up the output waveform at high power for that?
Sure - here's the waveform of the amp just dipping into AB - looks nice and clean to me. No global feedback either, yet the spectrum is a mess!
Compare with my 7+7W ECL82 amp using a regulated PSU. As expected, the power supply harmonics have vanished. Again this amp is capable of clean exceptional performance.
richy
Very nice FFT!
Here's anode currents and distortion waveform (now also nulled out slightly better)
") It still requires much tweaking and a real life version built. I have a feeling the bad performance in AB won't be such an issue in real life - other amps seem to get away with it!
It still requires much tweaking and a real life version built. I have a feeling the bad performance in AB won't be such an issue in real life - other amps seem to get away with it!Yes, I would think that all AB amps have crossover distortion when in Class B. The amount is dependant on the tube and its operating point.
When making some changes to my amp tonight, I threw the scope on the cathode resistor to see what the current looked in class B operation. The attached photo of the trace explains some of why Bigwill sees the significant high order harmonics. The cutoff is not as sharp as his model shows.
The top trace is across a 4R dummy load.
Attachments
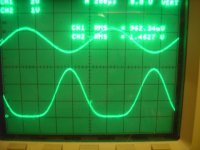
The attached photo of the trace explains some of why Bigwill sees the significant high order harmonics. The cutoff is not as sharp as his model shows.
The sharpness of my cutoff may be due to my extensive (excessive?) local feedback. This could be a double edged sword, amazing performance in Class-A, but terrible AB!
bigwill; in order to get good FFT readings in LtSpice, it is important to:
- turn compression off. Use ".option plotwinsize=0"
- set maximum time step to a low value such as 1u
- make the time for saving data a multiple of the period, say 10ms
SveinB
I indeed do this - I also use a timestep of 100ns and simulate for 100ms, maybe this isn't optimal, it certainly takes a while too
Last edited:
- Status
- This old topic is closed. If you want to reopen this topic, contact a moderator using the "Report Post" button.
- Home
- Amplifiers
- Tubes / Valves
- Does anyone have any FFT plots from real Class-AB tube amps?