I have a nice little amp going in SPICE - it simulates pretty well. Below 10W the distortion is very low both in amplitude and order. Above about 10W, the amp is no longer in Class-A. The output sine looks very clean but the FFT plot reveals a horrible spray of harmonics, starting at 50-60dB down and falling off with frequency.
Is the real life picture this bad for AB transitions? It seems like NFB would have a hard job clearing up the mess I see in simulation. I've always heard the AB transition wasn't so harsh with valves..
Can anyone offer an insight as to what a real tube amp looks like while running strongly in Class-AB in terms of spectra?
This is the spectrum of my OPUS at 1 Watt and 20 Watt. Not sure if that is what you mean by a "REAL" amp or not. But it physically exists and these are the measurements I took of it. I also am interested in some "REAL Commercial" amp spectrums as well so maybe somebody would post those spectrums.
It looks ugly but it is the best sounding amp I have ever built.
Is your sims using feedback?
It looks ugly but it is the best sounding amp I have ever built.
Is your sims using feedback?
Attachments
Physically existingNot sure if that is what you mean by a "REAL" amp or not.
")
Is your sims using feedback?
A lot of local feedback and a little global feedback. This seems to work very well during Class-A, in fact the results look very much like yours, low order/magnitude at low wattage and harmonic "grass" in Class-AB, although I must say your spectrum looks excellent, with everything above the 5th harmonic below 100dB!
Thanks John, the sound is wonderful. I have rolled a few tubes on the other channel and was able to get the even harmonics to be more dominant at a slight thd penalty. I'll post that on the OPUS thread in a little while.
I, like bigwill, am curious in reducing the "grass" at higher powers further. In my case with minimum feedback.
I, like bigwill, am curious in reducing the "grass" at higher powers further. In my case with minimum feedback.
Last edited:
I wonder if the higher harmonics is due to the global NFB, as the power increases and the corrections get bigger, all those just-not-in-time corrections cycle around and around spread all over.
I'd be interested to see what you get without any NFB (maybe just local FB).
How do you measure the FFT by the way.
I'd be interested to see what you get without any NFB (maybe just local FB).
How do you measure the FFT by the way.
What kind of output tubes? Also what is your driver stage?
I suppose if it is a 200W amp you may have an issue, however if it is a 15W amp, probably not so bad.
I had a similar moment/ feeling when I measured my amp at higher powers.
What does the FFT of the driver stage show?
I suppose if it is a 200W amp you may have an issue, however if it is a 15W amp, probably not so bad.
I had a similar moment/ feeling when I measured my amp at higher powers.
What does the FFT of the driver stage show?
And here's the plot of around 13W into 8ohms (no global feedback in both images), only just a touch into AB
Interesting..
Well I can only guess that you are using a larger section of the tube's 'almost straight line' and it's less straight at the extremes. Have you tried moving the bias point and re-simulating?
The answer it seems (if that's the reason) would be to run the tubes at higher voltage so the actual swing is more linear..
The only other effect is OPT saturation - not sure a simulator would 'know' anything about anything else - all Cs and Rs are perfect.
I am on my other computer so won't be able to post the measurements till tomorrow, however, I find that GNFB is only partly to blame for the harmonic spectra. When measuring the FFT at the grid of the Output Tube, I found that quite a bit of the distortion is from the drive section. With or Without NFB.
The level and number of higher order spike really go up when the LTP starts to do as Globultor says and hit the extremes. In my case the THD really starts to climb around 35-40Watts of output power.
The level and number of higher order spike really go up when the LTP starts to do as Globultor says and hit the extremes. In my case the THD really starts to climb around 35-40Watts of output power.
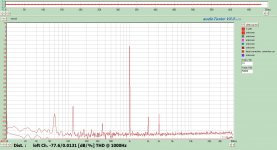
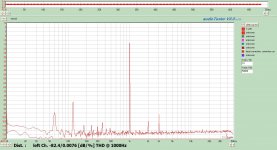
Here is the FFT spectra of the drive into the output tube. There is no GNFB. The power levels are recorded at the amplifier power level of 1Watt, 10 Watt and 40 Watt output into a 8R non inductive load.
I didn't make much effort to set the noise floor on the measurements and had to rescale slightly at the higher power levels. As you can see, the higher order harmonics are present even before the output tube. What I find interesting is the predominant 3rd order. That I believe is the particular T7 used in the LTP. I can roll tubes and change that. A T7 in this application is marginal at these drive levels, however, plays extremely well at "normal" power levels.
One other point when looking at your sim graphs is the scale. Your noise floor is way down past -140dB. I would think the error of the sim would have a large impact at this point.
Attachments
That I believe is the particular T7 used in the LTP.
Sorry to be picky but what is a T7, and what is an LTP?
TIA!
Sorry to be picky but what is a T7, and what is an LTP?
TIA!
T7=12AT7
LTP=long tailed pair
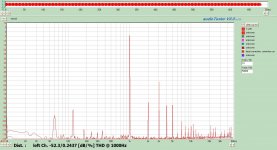
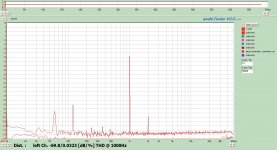
FFT of fully optimised top flight fixed bias 100W HiFi amp; typ AB o/p; conventional Williamson diff driver; concertina p/s. ..boasting 0.1% thd with 20dB global nfb. Trace 0dB = 100W level. ref 1Khz. (Ignore glitch spike at 15Khz) tube line up 4x 6550; 2x 12BY7;1x6BL8
Everyone should be able to get this performance.
richy
Everyone should be able to get this performance.
richy
Attachments
I suppose if I threw 3x the GNFb into the loop I could get close to that too.
At 100Watts my wifes pans fall out of the kitchen cabinets and I lose my happy home. Plus my little amp would go up in smoke at 100W (also bad for wife acceptance factor). Maybe I will try more feedback to see how low of a THD can be obtained at full power.
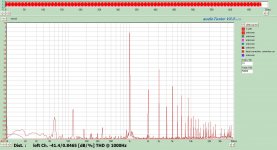
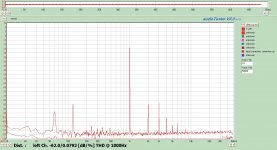
In the meantime at normal listening levels try this one. 0dB approx 50 Watts, ref 1KHz 2xKT88, 12at7, 12bh7 7.3dB feedback into 8 Ohms. FFT taken at 1Watt output. 0.0076%THD
At 100Watts my wifes pans fall out of the kitchen cabinets and I lose my happy home. Plus my little amp would go up in smoke at 100W (also bad for wife acceptance factor). Maybe I will try more feedback to see how low of a THD can be obtained at full power.
In the meantime at normal listening levels try this one. 0dB approx 50 Watts, ref 1KHz 2xKT88, 12at7, 12bh7 7.3dB feedback into 8 Ohms. FFT taken at 1Watt output. 0.0076%THD
Attachments
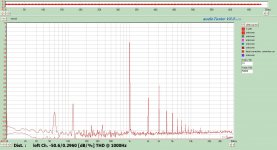
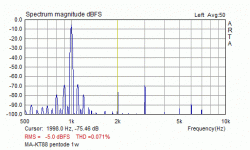
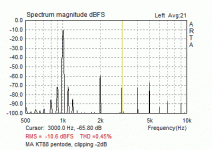
Here is a Williamson type amp with more modest 10dB of nfb.
FFT plot at 1W, and at 2dB below clipping.
Notice on both this and on Richy's FFT the IMD with 100Hz from the PS ripple (the spikes on both sides of the fundamental.
You will usually not see this with Spice.
SveinB
FFT plot at 1W, and at 2dB below clipping.
Notice on both this and on Richy's FFT the IMD with 100Hz from the PS ripple (the spikes on both sides of the fundamental.
You will usually not see this with Spice.
SveinB
Attachments
- Status
- This old topic is closed. If you want to reopen this topic, contact a moderator using the "Report Post" button.
- Home
- Amplifiers
- Tubes / Valves
- Does anyone have any FFT plots from real Class-AB tube amps?