Environmental effects of aviation - Wikipedia
Bill,
He doesn’t need a tin hat, just how to use a search engine.
Bill,
He doesn’t need a tin hat, just how to use a search engine.
You mean "Snowball Earth"? 650 million years ago, or the more recent version which carved out the midwest of the US? Undersea volcanoes, release of calcium carbonate CaCO3 put more CO2 into the atmosphere, release of various methylene compounds --NWe still need to know what caused the global warming that ended the ice ages as that happened before humanity and can't have been man made.
The Indians of western upstate New York collected petroleum liquids in deerskins from "seeps". That's how Olean NY got its name. Logical that the seeps were also leaking methane, after all it is the Marcellus Shale. Methane is potent in creating a warming blanket in the atmosphere.
We have settled into the typical northeast Ohio winter oscillating between snow and freezing rain! Blizzaks went on the urban assault vehicle last week.
He doesn’t need a tin hat, just how to use a search engine.
That link just says that the effect of con trails have not studied.
It gives plenty of information about the planes at the heads of the con trails.
Are you sure ?.....a few minutes with a search engine:
Empty skies after 9/11 set the stage for an unlikely climate change experiment.
Contrails reduce daily temperature range.
Clouds Caused By Aircraft Exhaust May Warm The U.S. Climate.
Those 9/11 figures were taken over a shorter period of time and did not allow for the thermal mass of the soil.
The con trails are bright and reflect some of the energy back into space. They may hold a bit of energy close to the ground but if it never gets to the ground in the first place then it is more likely over a longer period of time that cooling will result.
It took a week or more before the stronger daytime solar radiation began to bake the soil and a bit longer before it set off the bush fires.
...While tending crops on my plot I for the first time ever had to wear a hat to prevent sun burn in the spring....
Hydrochlorothiaz ?
...This ain't your mama's weather any more...
Dunno. In New Jersey in the 1960s I remember two brutal hurricanes and a waist-high snowfall in an inland area which never had either, before or since. A bit north, everybody was freaked by hurricane Sandy but my father was in the Long Island storm of 1938, which left scars for many years. Over 35% of New England's total forest area was affected...over 2.7 billion board feet of trees fell. Poorly predicted, part of how ~~700 souls perished.
And before my time: The Great Colonial Hurricane of 1635.
In that general area: of 21 hurricanes known, 3 in my life, 6 in my father's life. IMHO, major storms are not more or less long-view, but in many areas there was a 30-year lull starting around 1970.
And yes, pavement. Bound Brook NJ had three "100 year storms" in about 25 years, in large part because NewYorkers had suburbanized the hills upriver.
I think I've lived, mostly, in good times and places. I feel spoiled.
Attachments
The US National Science Foundation says the number of Category 4 and 5 Hurricanes Has doubled (!!!) Over the Past 35 Years: Number of Category 4 and 5 Hurricanes Has Doubled Over the Past 35 Years | NSF - National Science Foundation
I believe this is the 2013 research paper from which the NSF got that information: Recent intense hurricane response to global climate change | SpringerLink
Here is an excerpt from that same 2013 Holland/Bruyère research paper: "...the proportion of Category 4 and 5 hurricanes has increased at a rate of ~25–30 % per °C of global warming"
Note that polar areas are warming faster than tropical areas, and many regions of the planet have already exceeded 1.5 degrees C of warming, equivalent to 37.5% - 45% increase in Cat 4 and Cat 5 hurricanes. This pretty well matches the NSF soundbite.
Look at the tall yellow spikes in the attached graph of hurricane intensity vs time; the trend towards taller spikes in more recent years is strong enough to easily pick out with the unaided eye.
-Gnobuddy
Attachments
What about over the past 100 years?Over the Past 35 Years:
Look at the tall yellow spikes in the attached graph of hurricane intensity vs time; the trend towards taller spikes in more recent years is strong enough to easily pick out with the unaided eye.
I think the purple area marking the "Major hurricanes" also tell a bit about this. Nearly getting solid purple between 0-5 towards the end there.
-8
That data is in the bottom graph, which spans two centuries.What about over the past 100 years?
While we've done a lot of damage to our biosphere over the past two centuries, the situation started to worsen rapidly about twenty years ago, somewhere around the year 2000. A lot of bad things started happening more and more rapidly since then. Big floods, big hurricanes, big droughts, big wildfires, dying coral reefs, et cetera.
Did you know that half of all the fossil fuels ever burned by humankind, were burned in just the last 30 years? Yup, between 1990 and 2020 we burned as much fossil fuels as our ancestors did in all of human history prior to the year 1990.
In fact, fossil fuel use has been growing exponentially for the last two centuries, right along with the human population and economic growth.
The mathematical nature of the exponential curve says that in the next 30 years - from 2020 to 2050 - we will need to burn twice again as much fossil fuel as we did from 1990 to 2020. That's if we want to maintain the same standard of living, amount of food per person, and so on.
Even if we could find that much fossil fuel and extract it that rapidly, the already-collapsing biosphere won't take it.
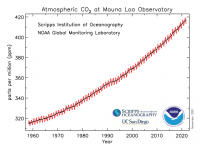
Right about this time someone will bring up alternative "clean" energy sources. The sad fact is that, while clean energy production has ramped up, it has had no effect on the total amount of fossil fuels we're burning. Look at the NOAA's daily CO2 measurements at their Mauna Loa observatory - an unbroken exponential rise in CO2 from 1958 until today: https://gml.noaa.gov/webdata/ccgg/trends/co2_data_mlo.png
The unavoidable conclusion is that we - meaning humankind in the collective - are not going to make it to 2050 "in the style to which we have become accustomed". Things will most certainly be worse. Exactly how much worse, nobody can say with accuracy.
-Gnobuddy
Attachments
It's raining steadily here, and has been for many hours.
I just walked to and from a nearby restaurant to get lunch. Lawns on both sides of the street have standing water on them, and excess water is flooding across the sidewalks and into the streets.
This part of this city is relatively high ground, so water doesn't pool in the streets here. I'm concerned about lower-lying areas of this city, and other even lower-lying cities to our east.
-Gnobuddy
Yikes. That's over 268mm/10.5 inches a month....Tofino...averages 3216mm / 126in a year.
I knew the city of Prince Rupert had just over 2.5 metres of rain per year (2530 mm/ 99.6 inches), and is listed as Canada's wettest city. But I didn't realize Tofino was even wetter.
I guess they don't need a bowl for their pet goldfish in Mawsynram...they can just swim about freely through what passes for "air" around there!...Mawsynram, at over 11,000 mm / 460inches.
-Gnobuddy
Hurricanes were worse back in 1930's and 50's. By the way, this and the rest of your post was debated in closed thread called The Arctic has become warmer by 5 degrees. Australia has snowed. and you were there too.While we've done a lot of damage to our biosphere over the past two centuries, the situation started to worsen rapidly about twenty years ago, somewhere around the year 2000.
No need to look, just open the front door and large rafts of it float buy.Have you started looking for gopher wood?
Well, that was fun... 4 days with no power, no cell signal. Definitely off grid! Thanks, Storm Arwen...
At least we have a backup bottled propane cooker, butane heaters, and a generator to recharge the laptops (to watch dvds on...). And a good old battery powered radio and an old landline phone that needs no external power...
And we all look younger by candlelight....
At least we have a backup bottled propane cooker, butane heaters, and a generator to recharge the laptops (to watch dvds on...). And a good old battery powered radio and an old landline phone that needs no external power...
And we all look younger by candlelight....
- Home
- Member Areas
- The Lounge
- The Weather