Krell ......!
Krell Full Power Balanced 350mc monoblock amplifier Measurements | Stereophile.com
This is a very quiet amplifier, with an A-weighted S/N ratio of more than 95dB. This is referenced to 2.83V output; this is equivalent of more than 130dB referenced to the amplifier's clipping point into 8 ohms! Even without the A-weighting network and extending the measurement bandwidth to 500kHz only worsened the S/N ratio to 84dB (again re. 2.83V).
Levels of harmonic distortion were also very low, particularly into higher impedance loads. The bottom trace in fig,3, for example, was taken at 2.83V into 8 ohms, and doesn't vary from 0.005% across the band. Reducing the load to 4 ohms increased the THD figure slightly to 0.007%, though into 2 ohms, the distortion went up to 0.03%.
There you go --- that's quite respectable, even with A-weighting. About 50uV rms at the output. Now the assumption there is that no hum etc. is going to come in at the higher powers to spoil the extrapolated >130dB. But still, these are numbers that should be, and apparently in this case are, achievable.
HFN/RR may have botched the measurement on the new stuff. Or did D. d'A. part company due to a philosophical disagreement? (I doubt it).
Thanks for digging up that reference. I was just on the verge of doing a search.
Yes, this is where 'everybody knows' perhaps clashes with physical reality. Unbypassed caps need low ESR for low total impedance. Bypassed caps need somewhat higher ESR for low total impedance. Even simple circuit theory can be counter-intuitive.
You said it, DF96.
As my late grandma used to say, we live and learn all our lives, yet we still die foolish.
Then again, to me at least, that was a delicious piece of info. The thing is, I love learning, and when something like that sort of unexpectedly flies in my face, I just thrive on it. That bit of info really made my week, I'm still mulling it over.
It's all like a big jigsaw puzzle and I'm enjoying putting it together.
There you go --- that's quite respectable, even with A-weighting. About 50uV rms at the output. Now the assumption there is that no hum etc. is going to come in at the higher powers to spoil the extrapolated >130dB. But still, these are numbers that should be, and apparently in this case are, achievable.
HFN/RR may have botched the measurement on the new stuff. Or did D. d'A. part company due to a philosophical disagreement? (I doubt it).
Thanks for digging up that reference. I was just on the verge of doing a search.
That same magazine did a test of Krell amps during the 90ies, specifically by Martin Colloms. He mildly criticized Krell for producing like 0.3% into 4 Ohms at rated power, 20 Hz to 20 kHz, I remember that distinctly.
Unfortunately, I don't remember the exact model under test, it's been some 14 years ago, or more.
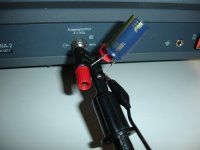
Some network analyser shots from today (first realistic measurements) :
1000uF/63 PanaFC + 220nF Wima MKS2 (upper trace) vs.
1000uF/63 PanaFC + 220nF Wima MKS2 + 3.3uF Wima MKS2 :
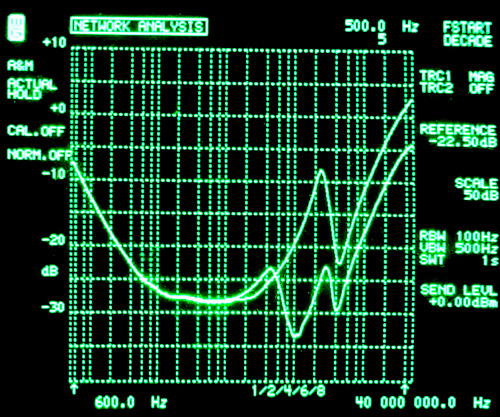
The PanaFC has seen some minutes of forming then some rest time to droop DA residual voltage of ~300mV after charging to 40V.
Vertical scale is dB ref 1 Ohm, so -20dB is 0.1Ohm etc.
The 1000uF should give 0.16Ohms at 1kHz --> -16dB, -14dB actual, OK.
ESR is at -28dB which amounts to 40mR, on spec too, fine.
With 220nF impedance peaks to over 0.3Ohms at 2Mhz. Paralleling the 3.3uF Wima MKS shows more wiggling but overall impedance stays below 0.1Ohm up to 8Mhz. It's seen that an impedance variation of more 10:1 can happen easily somewhere in the lower MHz frequencies.
Effect of a few cm of wiring forming some little loop inductance vs. shortest possible connection of the probe (and only 220nF bypass this time) :
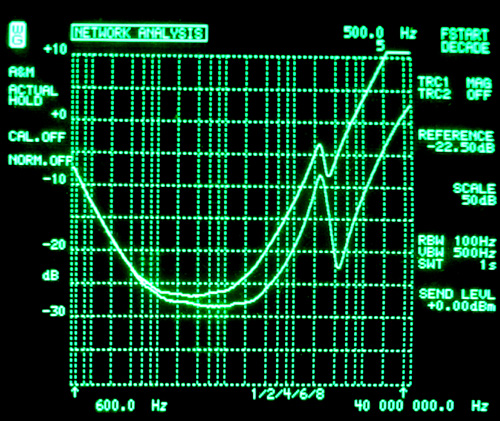
We can see the slight increase of ESR as well as a quite diminshed effect of the bypass and a 15dB (6x) increase of impedance above 4Mhz.
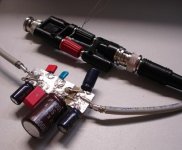
Physical setup showing the less than optimum connection with probe leads not right at the caps (shown with 3u3uF bypass) :

1000uF/63 PanaFC + 220nF Wima MKS2 (upper trace) vs.
1000uF/63 PanaFC + 220nF Wima MKS2 + 3.3uF Wima MKS2 :
The PanaFC has seen some minutes of forming then some rest time to droop DA residual voltage of ~300mV after charging to 40V.
Vertical scale is dB ref 1 Ohm, so -20dB is 0.1Ohm etc.
The 1000uF should give 0.16Ohms at 1kHz --> -16dB, -14dB actual, OK.
ESR is at -28dB which amounts to 40mR, on spec too, fine.
With 220nF impedance peaks to over 0.3Ohms at 2Mhz. Paralleling the 3.3uF Wima MKS shows more wiggling but overall impedance stays below 0.1Ohm up to 8Mhz. It's seen that an impedance variation of more 10:1 can happen easily somewhere in the lower MHz frequencies.
Effect of a few cm of wiring forming some little loop inductance vs. shortest possible connection of the probe (and only 220nF bypass this time) :
We can see the slight increase of ESR as well as a quite diminshed effect of the bypass and a 15dB (6x) increase of impedance above 4Mhz.
Physical setup showing the less than optimum connection with probe leads not right at the caps (shown with 3u3uF bypass) :
Attachments
Last edited:
Some network analyser shots from today (first realistic measurements) :
1000uF/63 PanaFC + 220nF Wima MKS2 (upper trace) vs.
1000uF/63 PanaFC + 220nF Wima MKS2 + 3.3uF Wima MKS2 :
The PanaFC has seen some minutes of forming then some rest time to droop DA residual voltage of ~300mV after charging to 40V.
Vertical scale is dB ref 1 Ohm, so -20dB is 0.1Ohm etc.
The 1000uF should give 0.16Ohms at 1kHz --> -16dB, -14dB actual, OK.
ESR is at -28dB which amounts to 40mR, on spec too, fine.
With 220nF impedance peaks to over 0.3Ohms at 2Mhz. Paralleling the 3.3uF Wima MKS shows more wiggling but overall impedance stays below 0.1Ohm up to 8Mhz. It's seen that an impedance variation of more 10:1 can happen easily somewhere in the lower MHz frequencies.
Effect of a few cm of wiring forming some little loop inductance vs. shortest possible connection of the probe (and only 220nF bypass this time) :
We can see the slight increase of ESR as well as a quite diminshed effect of the bypass and a 15dB (6x) increase of impedance above 4Mhz.
Physical setup showing the less than optimum connection with probe leads not right at the caps (shown with 3u3uF bypass) :
Can you rig up the ground reference for the scope to eliminate most of the ground lead? It may be a contributing factor in the measurement.
Your grandma must have been hewn from the same block as my grandma - that is the sort of thing she would have said!dvv said:As my late grandma used to say, we live and learn all our lives, yet we still die foolish.
The trick to remember about series-parallel components is that you get a form of inversion when converting from series to parallel or back again. Put a small resistor in series with a cap. Convert to parallel form at a particular frequency: you get a cap of almost the same value, but a parallel resistor with a big value. Make the small series resistor smaller, and the big parallel resistor gets bigger. The same thing happens if you replace the cap with an inductor. Put a cap and inductor in parallel and at resonance you see the big parallel resistor, not the small series resistor. The inductor is of course the big component which you bought as a capacitor.
What is more, the parallel resistor can vary like the square of the frequency or the inverse. This effect does not seem to be widely known, even among experienced engineers and academics.
Yes, that is uncontrolled factor as of yet. I plan to repeat measurements with a fully compensated setup on the weekend, cutting a short BNC interconnect in the middle and feeding the 75R input directly, as I figured out I won't need the high-Z probe with the suboptimal GND clip for the purpose. Also I'll do a check witha true low inductance 1R reference resistor instead of the 10R 0207 I used, a 1206 film chip type should hopefully be OK up to at least 10MHz. I'm still on a steep learning curve of using a network analyser, let alone at MHz freqs.Can you rig up the ground reference for the scope to eliminate most of the ground lead? It may be a contributing factor in the measurement.
@KSTR
Many thanks for your time and trouble. This is exactly what I asked about, I certainly didn't expect you to run out and buy some F&T large caps.
As John pointed out, the leads are much longer here than they would be if it was properly soldered to a circuit board. Which I believe would probably drop the overall value down a bit across the board, but I don't think it would change the curves significantly. Of course, I could be wrong.
This is of particular interest to me simply because these would be almost exactly the same values, only I assumed 2.2uF Wima MKS, no particular reason, it just seemed right. I assumed the size difference between the first (100uF) and the next (2.2uF) should be bigger than between the second and the last (100nF).
Again, no particular reason, it just seemed right.
Your grandma must have been hewn from the same block as my grandma - that is the sort of thing she would have said!
Most probably so, DF96. Those older folks were made sturdier than the kids of today, and they had no Tweeter or Facebook, they had to learn about life first hand. And life wasn't too kind to her, but that's another story.
The trick to remember about series-parallel components is that you get a form of inversion when converting from series to parallel or back again. Put a small resistor in series with a cap. Convert to parallel form at a particular frequency: you get a cap of almost the same value, but a parallel resistor with a big value. Make the small series resistor smaller, and the big parallel resistor gets bigger. The same thing happens if you replace the cap with an inductor. Put a cap and inductor in parallel and at resonance you see the big parallel resistor, not the small series resistor. The inductor is of course the big component which you bought as a capacitor.
What is more, the parallel resistor can vary like the square of the frequency or the inverse. This effect does not seem to be widely known, even among experienced engineers and academics.
In your view, how would the following work: 1st power input cap 100 uF, second in // 2.2 uF metallized foil, // 01, uF metallized foil, // 1R/2W metal film resistor in series with low inductance in series with 0.47 uF metallized?
Theoretically, the 1R+470 nF to the ground should rid the circuit of stray inductance. I ask because as you pointed out, on occasion it can all be counterintuitive.
Please note that the photo shows the case with the probe not wired correctly, with the correct position right at the caps I see a |Z| of 0.3R at 10Mhz with an inductive slope (using the 220nF curve). This amounts to a equivalent inductance of 0.3/(2pi*10Mhz) = 5nH which looks not to far off for a 5mm lead spacing, connected right at the cap (probably too low from overcompensation, see below).
The non-perfectly inductive behaviour at higher freqs is from a) running only 75R as the current source and b) having used a 10R 0207 for normalization -- again right at the resistor body -- of the setup (including the probe of course), which will be slightly inductive at some point and thusly will overcompensate.
So it's not a fully confident measurement, agreed, but OTOH it is not that far off to render it useless, and the relative relationships are not affected much at all.
Hi,
update on the parallel caps measurements.
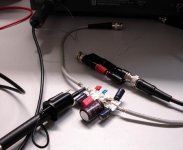
I've build a small test jig using a piece of double sided blank PCB inserted into a coaxial cable to start with a few pF of PCB capacitance, attaching the caps along the edges for lowest possible inductance that can be had with their case style:

Reference value for the DB scale is 1R as before, but I widened the freq. range from 100Hz to 100MHz, and freq. linearity was checked with a 1206 1R and was found to be neglegible at the vertical scaling used, only a few dB down at the highest freqs. (hence no normalizing needed). Also the 50R mismatch of the cable proved irrelevant.
A set of capacitors was found im my parts bin that gave a smooth and low impedance. The 1000uF was not a PanaFC but a specimen with 10dB lower ESR (almost down to 10mR), then I added WIMA MKS2 with 3u3, 220nF and an unidentified ceramic with 22nF(IIRC). Further addition of a set of 3 220u PanaFC smoothed and lowered things again and this is the final result :

This cap bank results in an impedance magnitude lower than 30mR from 4kHz to 10Mhz, going down to 10mR and not exceeding 20mR for the most part. Using the GND pigtail (see photo above) to fully short the caps resulted in only 5dB lower impedance at high freqs (with the HF sighature of the caps still seen) so this is the inductive baseline that can be had with this type of construction (and baseline dropped 6dB with another pigtail short as expected).
Shown for comparison is a short with 2pcs of thin solder wire (as it has some resistance, here to be found at ~6mR and was confirmed with a 4-wire measurement with my Keithley 191). Both the "cap jig" curve and the "short" curve show perfect capacitve and inductive slopes, resp., confirming the bulk capacitance value (~1500uF) and the inductance of the solder wire short (4nH looks OK for this 2 sections of ~1cm wire length).
The rise a LF for the solder wire short is coming from carrier residual leakage it seems (as I'm on right on the edge of the analyser's lower freq range of 100Hz as spec'd.)
Not shown here, the bad influence of too small caps was noted, adding eg 4n7 showed a much peakier/ragged response in the 10Mhz++ region, giving more than 20dB impedance variations within an octave or so of frequency.
To check any influence of the High-Z probe I did a comparison, too. The setup :

And the result :

Nothing to worry about, the active Probe seems a bit noisier (it also has 10dB loss which is acounted for automatically by the analyser) and has a bit more inductance above 20Mhz if the GND lead is bent such as to minimize inductance. The W&G-guys did a good job there, I'd say. Again with the large scale displayed any small transfer function error of the probe, while present, is irrelevant.
A network analyser is a really powerful tool, any tiny variantion of resistance, capacitance and inductance is readily seen (eg I saw ESR rise when the 1000uF cooled down after soldering). I'll do many more experiments as time permits and will share any noteworthy findings (new thread in the power supply forum, then).
update on the parallel caps measurements.
I've build a small test jig using a piece of double sided blank PCB inserted into a coaxial cable to start with a few pF of PCB capacitance, attaching the caps along the edges for lowest possible inductance that can be had with their case style:
Reference value for the DB scale is 1R as before, but I widened the freq. range from 100Hz to 100MHz, and freq. linearity was checked with a 1206 1R and was found to be neglegible at the vertical scaling used, only a few dB down at the highest freqs. (hence no normalizing needed). Also the 50R mismatch of the cable proved irrelevant.
A set of capacitors was found im my parts bin that gave a smooth and low impedance. The 1000uF was not a PanaFC but a specimen with 10dB lower ESR (almost down to 10mR), then I added WIMA MKS2 with 3u3, 220nF and an unidentified ceramic with 22nF(IIRC). Further addition of a set of 3 220u PanaFC smoothed and lowered things again and this is the final result :
This cap bank results in an impedance magnitude lower than 30mR from 4kHz to 10Mhz, going down to 10mR and not exceeding 20mR for the most part. Using the GND pigtail (see photo above) to fully short the caps resulted in only 5dB lower impedance at high freqs (with the HF sighature of the caps still seen) so this is the inductive baseline that can be had with this type of construction (and baseline dropped 6dB with another pigtail short as expected).
Shown for comparison is a short with 2pcs of thin solder wire (as it has some resistance, here to be found at ~6mR and was confirmed with a 4-wire measurement with my Keithley 191). Both the "cap jig" curve and the "short" curve show perfect capacitve and inductive slopes, resp., confirming the bulk capacitance value (~1500uF) and the inductance of the solder wire short (4nH looks OK for this 2 sections of ~1cm wire length).
The rise a LF for the solder wire short is coming from carrier residual leakage it seems (as I'm on right on the edge of the analyser's lower freq range of 100Hz as spec'd.)
Not shown here, the bad influence of too small caps was noted, adding eg 4n7 showed a much peakier/ragged response in the 10Mhz++ region, giving more than 20dB impedance variations within an octave or so of frequency.
To check any influence of the High-Z probe I did a comparison, too. The setup :
And the result :
Nothing to worry about, the active Probe seems a bit noisier (it also has 10dB loss which is acounted for automatically by the analyser) and has a bit more inductance above 20Mhz if the GND lead is bent such as to minimize inductance. The W&G-guys did a good job there, I'd say. Again with the large scale displayed any small transfer function error of the probe, while present, is irrelevant.
A network analyser is a really powerful tool, any tiny variantion of resistance, capacitance and inductance is readily seen (eg I saw ESR rise when the 1000uF cooled down after soldering). I'll do many more experiments as time permits and will share any noteworthy findings (new thread in the power supply forum, then).
Some forum quirk I think (I note there is no preview thumbs as well, but the pics are visible for me),
Maybe a moderator can fix it, in the meantime find them re-attached here :
Maybe a moderator can fix it, in the meantime find them re-attached here :
Attachments
John, you input is welcome of course. Are you talking about the GND lead of the probe or is it about another specific part of the jig (I can't figure it out)?
Eyeballing from the plots I see an inductive slope with a Z of about .3R @ 10Mhz which is quite smallish ~0.5nH total residual inductance for the whole shebang, even with a say +-10dB uncertanity I wouldn't speak of that dominating the measurement?
Eyeballing from the plots I see an inductive slope with a Z of about .3R @ 10Mhz which is quite smallish ~0.5nH total residual inductance for the whole shebang, even with a say +-10dB uncertanity I wouldn't speak of that dominating the measurement?
Last edited:
Yes, very nice work, good to see the LTspice exercises being confirmed so clearly. Personally, I would like to see 1mR at 100kHz, and then working carefully to keep below 10mR as you progress higher in frequency; I think 100mR at 100MHz, 1R at 1GhZ is about the best one can do unless you go crazy with RF techniques, etc.
Frank
Frank
Thanks, Frank.
Now I'm finally able to back-match my sims to reality. I'll try building a few "super cap strips" with 10000uF bulk capacitance next where I will try to reach for your goal. It'll sure tackle my skills and that of the SNA-2 analyser, with its 180Mhz spec'd limit.
Now I'm finally able to back-match my sims to reality. I'll try building a few "super cap strips" with 10000uF bulk capacitance next where I will try to reach for your goal. It'll sure tackle my skills and that of the SNA-2 analyser, with its 180Mhz spec'd limit.
- Status
- Not open for further replies.
- Home
- Member Areas
- The Lounge
- Sound Quality Vs. Measurements