You won't believe. In person he is very nice.
I'm sure he is very nice when his neck is within arm's reach.

se

I hope that you are being facetious..............
No.
I'm being a smartass.
se
No, FM sidebands do not look like that. I do have some screen captures on another computer that I can access later on.
Looking at an FM modulated carrier will show a continuous series of sidebands because the frequency of the carrier is being swept up and down (= frequency modulation). The deviation (or how many KHz the carrier is offset) represents the amplitude of the modulating signal. How quickly the carrier is swept back and forth is dependent on the frequency of the modulating signal.
Now, that signal does represent what you might see with an amplitude modulated carrier. This is when you will see sum and difference products between the modulating signal and a carrier. That shouldn't be surprising to anyone as it is this process that creates harmonics of fundamental frequencies. Non-linearities in the transfer function will mix the two frequencies together giving us those new sum and difference frequencies. That is also called heterodyning, the way we change frequencies from the original carrier frequency (say 107.1 MHz) to another intermediate frequency that remains constant (say, 10.7 MHz). We apply the local oscillator frequency that is a constant 10.7 MHz difference from the frequency we want to receive. We just tune the filter to the difference frequency between the local oscillator and the frequency of interest. The constant frequency of the IF allows us to amplify and control the passband much more accurately. The FM modulation carries through this process ( it appears in both the sum and difference because one of the original frequencies is FM modulated). In fact, if we FM modulate the local oscillator and mix it with a carrier that is not modulated, the result is indistinguishable from the first case.
Anyway, that is roughly how both AM and FM RF stages work. In the AM case, the local oscillator (LO) is kept normally about 455 KHz above the frequency we want to receive. I'm pretty tired right now (it's about 1:20 AM here), so I apologize if I'm lacking continuity with this post. The intent is to try and explain what an FM modulated carrier looks like, and why the diagram in post 971 looks more like AM modulation (with many frequencies). I think some of the amplitudes are incorrect though, like 15 and 15.9 KHz as an example. How exactly did this diagram come to be?
-Chris
PERFECT!
You can give John the honor of setting me ablaze.
se
I'll propose Mark to auction off that right. Should pay fully for BAF2010
jd
Just so young folks reading here can learn something from this exercise. When faced with a complex spectra vary each frequency a little and note the amount and direction that the spur of interest moves. This will give you the order and sign of each component. For instance F1 – 3*F2 will move positive one Hertz per Hertz with F1 and negative 3 Hertz per Hertz with F2. This will prove invaluable if 3 frequencies are inter-modulating.
If the spur does not move it is not related to that input frequency. If it never moves it is contamination.
Without the phase information it might be difficult to separate AM and FM.
Chris is correct that plot can be generated with nothing but AM, in fact an unbalanced passive mixer will create spurs at all those frequencies (and more).
Last edited:
Like so:
Over to you,
jd
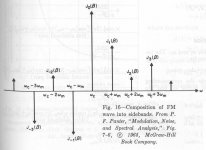
Essentially you on on the right track. I just remembered one of my "bible" references the old ITT "Reference Data for Radio Engineers". Here is their plot. They also have a nice vector description of how AM and PM are not seperable without the phase information. There are no non-harmonically related frequencies here.
Anyone can repeat this, a single self biased npn mixer will produce all those spurs (at different amplitudes of course).
Attachments
Jan
RE: John, if you plot the following components:
2F2-4F1;
2F2-5F1;
2F2-6F1;
2F2-7F1;
etc.
where do these components fall on the graph?
Looking at 2F2 - 9F1 does seem to line up at the first previously unlabeled spike, but F2-5F1 is almost 10 db lower than the unlabeled spike. I would expect 9F1 from a square wave to be 5.1 db lower and 2F2 from a "sine" wave (ca 1970) to be at least 60 db lower. So for the spike to be about 9 db higher is interesting.
The time delay for a 741 type op amp is around .5 microseconds. This varies quite a bit and also does not correlate with the spike.
I do not like the term PIM for distortion introduced by time delay in a feedback system. The term is more often used for Passive Intermodulation Distortion. See http://www.boonton.com/products/pim20/datasheet/PimTestSet_BTN_WEB.pdf for how the RF folks measure this. If you see an uncanny resemblance to what some people think is happening with audio cables and connectors, you will understand why I think we should use PIM the same way as the RF folks.
ES
I'll propose Mark to auction off that right. Should pay fully for BAF2010
Well, if I'd have known that, I'd have worked much harder this past year at being an even bigger ******* so that you could have netted enough to fly everyone to Hawaii for BAF2010.
se
Well, if I'd have known that, I'd have worked much harder this past year at being an even bigger ******* so that you could have netted enough to fly everyone to Hawaii for BAF2010.
se
There's a limit to the size of *** holes. Even for you
jd
Extra thanks Scott, for posting that graph. Mitch Cotter asked me to refer to the ITT Reference guide, in order to clarify FM modulation questions that I was asking him over the phone just this week. Unfortunately, mine got destroyed in the firestorm, and I was forced to use another reference, that I put up here (p15-26).
Your graph is even better, although mine would have worked as well.
FINALLY, we are on same page.
Now, what are those extra 'inharmonic' extra pips? Are they AM, FM, or what, and what is the most REASONABLE explanation for them? (Hint, remember your colleague, Barrie Gilbert's findings?)
In any case, they have remained there for 34 years, untouched by any critic or colleague, EXCEPT by Mitch Cotter, who mentioned them to me, just recently, and I tried to put this 'mystery' up for everyone to see and wonder about. Why Mitch? Because he designs FM systems and has done so for the last 60 years, and he is good at noticing these things. Thank goodness. Now, can we discuss this and perhaps resolve it more deeply.
At the same time, as I designed the AD797 in my new Parasound phono stage using your suggestion for pin 8, instead of Dicks' approach, I sincerely hope that my other associate, a design engineer for more than 30 years, finds little or no PIM in that IC. However, I think that it should be tested for, just to know. We already know that it is almost perfect in AM distortion as well as low noise. It is just that nagging feeling that FM distortion could be present in small quantities, at least at a subliminal level.
Now, isn't this worth a look?
I have been able to duplicate, at least visually, one set of sidebands, by FM modulating a 3.18KHz sine wave (Fc) with a level controlled amount of 1.8KHz, and I get an amazing correlation to the sidebands on Fig 3. Why 1800 Hz or so, I don't know, BUT it is the same graphical results CAN be shown with this scheme.
I used a Wavetek 166 function generator with an FM input, set at 3.18KHz and an ST oscillator for finding and setting the level at 1800Hz or so.
It should be noted that we usually never go beyond the first order of sidebands although it is easy to do with this test set-up.
I used a Wavetek 166 function generator with an FM input, set at 3.18KHz and an ST oscillator for finding and setting the level at 1800Hz or so.
It should be noted that we usually never go beyond the first order of sidebands although it is easy to do with this test set-up.
There's a limit to the size of *** holes. Even for you
Ooooh. I love a challenge.
BAF Hawaii 2011, here we come!
se
Ooooh. I love a challenge.
BAF Hawaii 2011, here we come!
se

Now back on topic pls...
Extra thanks Scott, for posting that graph. Mitch Cotter asked me to refer to the ITT Reference guide, in order to clarify FM modulation questions that I was asking him over the phone just this week. Unfortunately, mine got destroyed in the firestorm, and I was forced to use another reference, that I put up here (p15-26).
Your graph is even better, although mine would have worked as well.
FINALLY, we are on same page.
Now, what are those extra 'inharmonic' extra pips? Are they AM, FM, or what, and what is the most REASONABLE explanation for them? (Hint, remember your colleague, Barrie Gilbert's findings?)
In any case, they have remained there for 34 years, untouched by any critic or colleague, EXCEPT by Mitch Cotter, who mentioned them to me, just recently, and I tried to put this 'mystery' up for everyone to see and wonder about. Why Mitch? Because he designs FM systems and has done so for the last 60 years, and he is good at noticing these things. Thank goodness. Now, can we discuss this and perhaps resolve it more deeply.
At the same time, as I designed the AD797 in my new Parasound phono stage using your suggestion for pin 8, instead of Dicks' approach, I sincerely hope that my other associate, a design engineer for more than 30 years, finds little or no PIM in that IC. However, I think that it should be tested for, just to know. We already know that it is almost perfect in AM distortion as well as low noise. It is just that nagging feeling that FM distortion could be present in small quantities, at least at a subliminal level.
Now, isn't this worth a look?
John,
Those unlabeled blips near 1 kHz and 5 kHz appear to be at 1.38 kHz and at 4.98 kHz, being the 2f2 - 9f1 and 11f1-2f2 combinations. The blips lie +- 1800 Hz about the 3.18 kHz carrier.
They are harmonically related to the test tones, and are definitely in the category of expected spectra for this test, especially when one is pounding the cr@p out of a 741, driving it essentially to slew rate limiting with even the 30 kHz filtering.
BTW, it was unclear in my reading of the paper whether the test for Figure 3 was using 30 kHz or 100 kHz; I suspect and assume 30 kHz, but I could not find where it was stated.
The authors themselves stated the following: "... the measurement result of the popular operational amplifier uA741, which represents a case of very strong dynamic intermodulations, where also second-order products such as 2f2 +/- nf1 ... rae generated. Traces of these can be found in Fig. 3." The authors did not label these traces that you seem to think are mystery blips. Not a single 2f2 spectral line is labeled in Figure 3.
No mystery here.
Cheers,
Bob
This looks remarkably like spinning side band contamination of an MRI spectra.
http://www.diyaudio.com/forums/attachment.php?attachmentid=140090&stc=1&thumb=1&d=1252100293
OK, that was suppose to be a picture.
Try here.
http://www.diyaudio.com/forums/showpost.php?p=1916032&postcount=971
http://www.diyaudio.com/forums/attachment.php?attachmentid=140090&stc=1&thumb=1&d=1252100293
OK, that was suppose to be a picture.
Try here.
http://www.diyaudio.com/forums/showpost.php?p=1916032&postcount=971
Last edited:
Point well taken, but look at the levels, are they not a little too much to ignore? I would have to do the entire test over, just to be sure, because the actual waveform frequencies are guessed at (by Janneman, I presume), and not measured. Also, we don't have the spectrum changes with level, that are not put on the paper. This is unfortunate, because I did many of the tests, myself, and this would bring out any real deviations.
However, I give it over to you, that the added IM byproducts 'could' be accounted for, perhaps. I still am not sure about this, because FM modulation of the the fundamental test frequency would create the same sort of symmetrical sidebands. Perhaps, my other associate will resolve this dilemma in a few months (that is what he told me, last week) when he decides to show me how to measure PIM by HIS method.
However, I give it over to you, that the added IM byproducts 'could' be accounted for, perhaps. I still am not sure about this, because FM modulation of the the fundamental test frequency would create the same sort of symmetrical sidebands. Perhaps, my other associate will resolve this dilemma in a few months (that is what he told me, last week) when he decides to show me how to measure PIM by HIS method.
John,
Those unlabeled blips near 1 kHz and 5 kHz appear to be at 1.38 kHz and at 4.98 kHz, being the 2f2 - 9f1 and 11f1-2f2 combinations. The blips lie +- 1800 Hz about the 3.18 kHz carrier.
They are harmonically related to the test tones, and are definitely in the category of expected spectra for this test, especially when one is pounding the cr@p out of a 741, driving it essentially to slew rate limiting with even the 30 kHz filtering.
BTW, it was unclear in my reading of the paper whether the test for Figure 3 was using 30 kHz or 100 kHz; I suspect and assume 30 kHz, but I could not find where it was stated.
The authors themselves stated the following: "... the measurement result of the popular operational amplifier uA741, which represents a case of very strong dynamic intermodulations, where also second-order products such as 2f2 +/- nf1 ... rae generated. Traces of these can be found in Fig. 3." The authors did not label these traces that you seem to think are mystery blips. Not a single 2f2 spectral line is labeled in Figure 3.
No mystery here.
Cheers,
Bob
You're welcome:
http://www.diyaudio.com/forums/showpost.php?p=1916032&postcount=971
jd
Point well taken, but look at the levels, are they not a little too much to ignore? I would have to do the entire test over, just to be sure, because the actual waveform frequencies are guessed at (by Janneman, I presume), and not measured. [snip].
It's all in the paper, John. It sometimes pays to read your own paper from time to time; your memory can play dirty tricks on you after so many years.
jd
- Status
- Not open for further replies.
- Home
- Member Areas
- The Lounge
- John Curl's Blowtorch preamplifier part II