I called the rebuild of an old 4th order BP system I built an "enigma" because the FR does not match the prediction from the sim (bandwidth is wider by a noticeable amount, and the passband response tilts a little downwards rather than upwards as expected).
I've run into another "enigma" with this build. The raw response of the original build shows a significant peak just under 400 Hz, a peak that decreased significantly in magnitude when I cut the vents down a bit to "fix" the passband.
I thought that peak had something to do with the pipe resonance of the vents and their interaction with the enclosure, as it increased slightly as I cut down the vents. In fact, I was thinking of using this effect to determine best size and location for a vent in an enclosure, by trying to figure it out mathematically.
However, apparently that peak in the out of band response has nothing to do with the pipe resonances of the vents.
The pipe resonance frequencies for a pipe that's open at both ends is given by the equation: F") = =n*c/(2*(L+0.8*D)), where n-1,2,3.., c=speed of sound (m/s), L = length of the pipe (m), and D = diameter of the pipe (m). The "Enigma" sub has two 3" vents that are effectively 21.5 cm long. Using c=344m/s, F(1) works out to 623 Hz, much higher than that ~400 Hz peak, suggesting that it has nothing to do with pipe resonance effects.
= =n*c/(2*(L+0.8*D)), where n-1,2,3.., c=speed of sound (m/s), L = length of the pipe (m), and D = diameter of the pipe (m). The "Enigma" sub has two 3" vents that are effectively 21.5 cm long. Using c=344m/s, F(1) works out to 623 Hz, much higher than that ~400 Hz peak, suggesting that it has nothing to do with pipe resonance effects.
So, where is that 400 Hz resonance peak coming from?
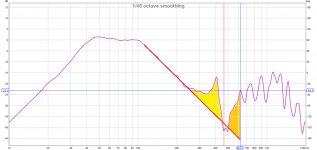
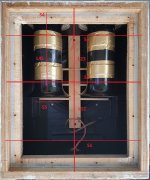
My next guess is that it's primarily some sort of resonance mode caused by the dimensions of the rectangular box that makes up the vented section of the subwoofer, which I think is closer to the truth. However, with internal dimensions of 38.1 x 31.8 x 21 cm, the lowest resonance modes work out to be 451 Hz, 542 Hz and 821 Hz. In the attached image, I've added a vertical red line indicating the enclosure's lowest resonance mode, which is still noticeably off from that 400 Hz peak.
What could it be? Any ideas?
I've run into another "enigma" with this build. The raw response of the original build shows a significant peak just under 400 Hz, a peak that decreased significantly in magnitude when I cut the vents down a bit to "fix" the passband.
I thought that peak had something to do with the pipe resonance of the vents and their interaction with the enclosure, as it increased slightly as I cut down the vents. In fact, I was thinking of using this effect to determine best size and location for a vent in an enclosure, by trying to figure it out mathematically.
However, apparently that peak in the out of band response has nothing to do with the pipe resonances of the vents.
The pipe resonance frequencies for a pipe that's open at both ends is given by the equation: F
= =n*c/(2*(L+0.8*D)), where n-1,2,3.., c=speed of sound (m/s), L = length of the pipe (m), and D = diameter of the pipe (m). The "Enigma" sub has two 3" vents that are effectively 21.5 cm long. Using c=344m/s, F(1) works out to 623 Hz, much higher than that ~400 Hz peak, suggesting that it has nothing to do with pipe resonance effects. So, where is that 400 Hz resonance peak coming from?
My next guess is that it's primarily some sort of resonance mode caused by the dimensions of the rectangular box that makes up the vented section of the subwoofer, which I think is closer to the truth. However, with internal dimensions of 38.1 x 31.8 x 21 cm, the lowest resonance modes work out to be 451 Hz, 542 Hz and 821 Hz. In the attached image, I've added a vertical red line indicating the enclosure's lowest resonance mode, which is still noticeably off from that 400 Hz peak.
What could it be? Any ideas?
Attachments
Right after posting my question, I think I found the answer .
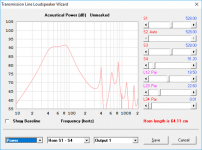
I redid the Hornresp model for my 4th order BP build, this time modeling it as an offset driver horn, with the vented section being the "horn". Basically I used S1-S2,S2-S3 and L12 and L23 to describe the net volume vented section and the location of the driver within it, S3-S4 and L34=0.01 to simulate the step down to the vent's diameter, and then S4-S5 and L45 to simulate the vent. It's not perfect (perfect alignment with the sim would require that the vent be mounted outside of the box, not inside of it), but the 400 Hz peak, and subsequent dip shows up in the sim.
This opens up some interesting things:
1. The out of band noise exiting a 4th order BP's vent can be modeled in some circumstances.
2. It may be possible to reduce this out of band noise by choosing appropriate cabinet dimensions and the location of the driver within the cabinet. The effect can also be modeled before building the enclosure.
.I redid the Hornresp model for my 4th order BP build, this time modeling it as an offset driver horn, with the vented section being the "horn". Basically I used S1-S2,S2-S3 and L12 and L23 to describe the net volume vented section and the location of the driver within it, S3-S4 and L34=0.01 to simulate the step down to the vent's diameter, and then S4-S5 and L45 to simulate the vent. It's not perfect (perfect alignment with the sim would require that the vent be mounted outside of the box, not inside of it), but the 400 Hz peak, and subsequent dip shows up in the sim.
This opens up some interesting things:
1. The out of band noise exiting a 4th order BP's vent can be modeled in some circumstances.
2. It may be possible to reduce this out of band noise by choosing appropriate cabinet dimensions and the location of the driver within the cabinet. The effect can also be modeled before building the enclosure.
Attachments
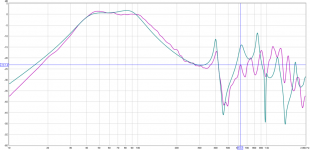
...and here's how that 400 Hz peak can be addressed by just moving the driver a few cm in the enclosure, according to the Hornresp sim. I've also sim'd the addition of some stuffing to the vented section. Now, the only out of band stuff appears above 600 Hz, where it's a bit more easier to deal with, and also measures quite a bit lower than the sim suggests. Wins all around.
Attachments
very interesting find Brian! How do you translate the placement of the driver in the simulation to the actual position of the driver in the design?
The attached diagram serves to illustrate how I laid out the model.
Note that as the vents are inside of the enclosure, I worked out the volume they displaced in the enclosure, then adjusted S1 (=S2 = S3) so that when it was multiplied by L12+L23, the result was the net volume of the vented section of the enclosure. Also, as there are two vents, I doubled the CSA of one vent to represent S4.
I was actually quite surprised that the model turned out to be so close to what was measured. This enclosure was built many years ago, when I was using lumped-mass modeling, and with that type of model, the location of the driver in the enclosure doesn't make a difference. It's evident from the Hornresp model that the position of the driver actually DOES make a difference, and can impact the amount of out of band noise that can make its way out of the enclosure.
Attachments
Last edited:
Yeah, that's been the assumption and I still promulgate it for cubes, vent location because it's mostly true, but learned long ago that driver location is ~fixed at ~50% for low aspect ratio rectangles, sliding up for inverse tapered and down a bit for horn tapered.
I pointed this out to a then prominent designer, but was brusquely told to educate myself at a local college library before posting again, so not being interested enough to do what it took to prove it....... fast forward to MJK's software, which simmed it at ~42% made me wonder if the crude measurements I'd done could be this far off and now HR at ~51% makes me feel much better!
GM
Pretty interesting work Brian. Now you have to build a box with your driver offset and shelf ports to prove out the simulation.
Kind of blows me away that a speaker simulation tool that started decades ago on punch cards is still current with your design work. I guess physics doesn't change after all!
Kind of blows me away that a speaker simulation tool that started decades ago on punch cards is still current with your design work. I guess physics doesn't change after all!
Pretty interesting work Brian. Now you have to build a box with your driver offset and shelf ports to prove out the simulation.
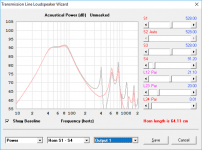
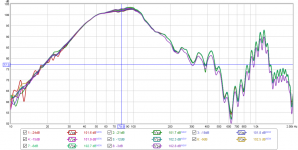
I actually have another 4th order BP on hand at the moment, a smaller one that built before the "Enigma" that has a similar "offset drive" arrangement. When I get the chance, I'm going to perform some more measurements on that one as well to see if the shape of the out of band noise from that build matches an offset driver sim of that build. However, the shape of the response curve does suggest that there is some nulling going on that's not predicted by the current Hornresp BP4 sim (see attached - the null is appearing just above 600 Hz - the peak just above that is damped by the damping material that I have in the vented section of the system).
Another thing I noticed with these builds is that the shape of the response curve can change a bit at different power levels, some times in strange ways. For example, for this smaller enclosure, it looks like the system gets MORE efficient (by about 1.2 dB @ 80 Hz) as power is increased.
Attachments
The guys behind the parameters we use were smart to stae that small signal data only was important.
Among many reasons are the differences in the magnetic flux saturation in the steel in a motor structure. As the coil moves up and down it is not in exactly the same conditions all along the stroke. Keeps things interesting when designing a driver. But those wonderful small signal specifications are exactly that. Small signal. Your on your own when you try and calculate for higher power responses. LinearX had a program called LEAP that was much more accurate for higher power simulations of vented and sealed enclosures. Not sure if the program was applicable to bandpass enclosures. Also there is a program that runs through a spreadsheet called Unibox. It is quite accurate as well. But not applicable to bandpass enclosures.
Among many reasons are the differences in the magnetic flux saturation in the steel in a motor structure. As the coil moves up and down it is not in exactly the same conditions all along the stroke. Keeps things interesting when designing a driver. But those wonderful small signal specifications are exactly that. Small signal. Your on your own when you try and calculate for higher power responses. LinearX had a program called LEAP that was much more accurate for higher power simulations of vented and sealed enclosures. Not sure if the program was applicable to bandpass enclosures. Also there is a program that runs through a spreadsheet called Unibox. It is quite accurate as well. But not applicable to bandpass enclosures.
- Status
- This old topic is closed. If you want to reopen this topic, contact a moderator using the "Report Post" button.
- Home
- Loudspeakers
- Subwoofers
- Another enigma with my "Enigma"