Given a driver's Xmax, HR can give you an idea of how much voltage would be required to exceed it in a particular alignment. I have heard that this prediction could be a bit conservative. Has anyone done any tests to confirm if this is the case, and if so how far off the prediction could be? And how would one go about testing something like this?
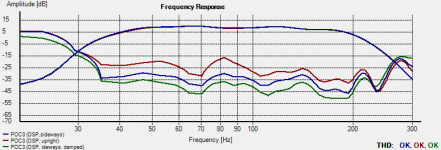
My interest was piqued when I took a look at another measurement I'd done recently, this one concerning my POC's response at different power levels, and I realized that at the peak level (in red in the graph attached), the amp may have been giving out over three times what the HR prediction said would be required for the driver to exceed Xmax, and yet there was no major increase in distortion between 40 Hz (minimum predicted excursion) and 50 Hz (maximum predicted excursion). In normal use I notice that it's unlikely for the POC3 to make any gross noises when driven with the iNuke 3000DSP (280W RMS), but it's a lot easier to achieve that when it's driven by my Alpine PDX-M12 car audio amplifer that's capable of about 600W RMS into the POC3's 8 ohm impedance.
How does one go about giving a "power rating" for a DIY subwoofer design anyway?
Attachments
Given a driver's Xmax, HR can give you an idea of how much voltage would be required to exceed it in a particular alignment. I have heard that this prediction could be a bit conservative.
Hi Brian,
If you find that a higher voltage than predicted can be applied to achieve a given diaphragm displacement, then the system is behaving non-linearly. This is something that Hornresp cannot model (except in the Power Compression tool, where diaphragm displacement decreases as the voice coil temperature is increased).
Better for the maximum voltage prediction to be conservative rather than optimistic - less chance of destroying a driver that way...
") .
.Kind regards,
David
Thermal compression in a driver is very rarely even quoted in the manufacturers specifications. Consider that the Precision devices PD 1850 1851-1852 18" drivers proudly claim 1.6-1.7db compression at their rated power, and these drivers have a 5" voice coil. So we can probably assume that most drivers are far worse than this.
Hi Brian,
If you find that a higher voltage than predicted can be applied to achieve a given diaphragm displacement, then the system is behaving non-linearly. This is something that Hornresp cannot model (except in the Power Compression tool, where diaphragm displacement decreases as the voice coil temperature is increased).
Better for the maximum voltage prediction to be conservative rather than optimistic - less chance of destroying a driver that way...
Kind regards,
David
Hi David, I wasn't referring to power compression caused by the coil heating up at high power levels, but the difference in predicted vs. actual excursion at a given voltage input. The signals I used for the test for example were way too short to cause any appreciable heating of the speaker's voice coil.
Hi David, I wasn't referring to power compression caused by the coil heating up at high power levels, but the difference in predicted vs. actual excursion at a given voltage input. The signals I used for the test for example were way too short to cause any appreciable heating of the speaker's voice coil.
Hi Brian,
What was the input voltage used for the test, and how was the actual diaphragm displacement measured?
Kind regards,
David
Hi Brian,
What was the input voltage used for the test, and how was the actual diaphragm displacement measured?
Kind regards,
David
HI David, I haven't done any detailed measurements yet. I'm just making an observation based on the SPL & distortion curves I posted earlier.
HornResp says this particular design can take an input of 21.5V before Xmax is exceeded @ 53 Hz. This translates to just under 89W if we consider the driver's Re of 5.2 Ohms (or just under 58W if we use the nominal impedance of 8 Ohms).
One of the measurements displayed in my graph was done just below the amp's clipping point, and the amp is rated at 280W into 8 Ohms. Working backwards, HornResp suggests that the excursion at 52.5 Hz would be just under 9mm, quite a bit over this driver's rated Xmax of 5mm.
I guess I expected to see a marked increase in distortion around 52.5 Hz compared to that at 40 Hz because of this, but that doesn't appear to be so in the graph.
Looks like it's time to take more detailed measurements, and this time take the voltage at each test point to confirm the amp is actually providing that power it says it's providing, but I'm not sure what would be the best, most accurate way for a DIYer to measure the excursion of a driver loaded into a TH...
Brian,Looks like it's time to take more detailed measurements, and this time take the voltage at each test point to confirm the amp is actually providing that power it says it's providing, but I'm not sure what would be the best, most accurate way for a DIYer to measure the excursion of a driver loaded into a TH...
Persistence of vision, a white dot on the cone near the surround and a ruler make it quite easy to measure the peak to peak movement of a cone driven with a sine wave. Divide the peak to peak by 2 for excursion, as Xmax is a one-way travel. Wear hearing protection. Measure quickly, sine waves have a lot more average power than most music, and double the average power of the 6 dB crest factor AES pink noise signal.
Suspensions are often stiff enough, and magnetic force reduces so much past Xmax that you may see little more excursion regardless of power input past what is predicted to achieve Xmax.
Art
Brian,
Persistence of vision, a white dot on the cone near the surround and a ruler make it quite easy to measure the peak to peak movement of a cone driven with a sine wave. Divide the peak to peak by 2 for excursion, as Xmax is a one-way travel. Wear hearing protection.
That might be a bit difficult to do with the driver in the box, and of course there's the question of taking the signal quickly enough so the voice-coil doesn't have time to heat up and affect the measurement. I'll give it a dry-run with my POC3 TH.
Suspensions are often stiff enough, and magnetic force reduces so much past Xmax that you may see little more excursion regardless of power input past what is predicted to achieve Xmax.
Agreed. I was expecting however to see a somewhat significant increase in distortion in the measurements though. This didn't happen. Or perhaps I'm expecting to be a bit more noticeable than it actually was.
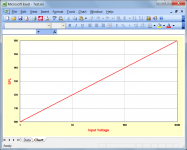
I've an idea - I'm going to try repeating the measurements, this time taking note of the actual input level and the output level. An increase of xdB in the input level should result in an increase of xdB in the output level, if the response is linear. By doing this with short 53 Hz sine bursts input into the sub, starting at 2.83Vand plotting the delta changes between input (say in 0.5db steps) and output (as measured by an RTA in peak capture mode) on a graph as I increase the input level, I should be able to tell where the response goes non-linear, and by how much.
I'm going to try repeating the measurements, this time taking note of the actual input level and the output level. An increase of xdB in the input level should result in an increase of xdB in the output level, if the response is linear.
Hi Brian,
Plotting voice-coil input voltage against output SPL on a log-linear chart, a linear response should look as shown in the attachment (actual SPL values will depend upon the efficiency of the system being tested). Doubling the input voltage results in a 6 dB increase in SPL. A ten-fold increase in input voltage gives a 20 dB increase in SPL.
Kind regards,
David
Attachments
I've an idea - I'm going to try repeating the measurements, this time taking note of the actual input level and the output level. An increase of xdB in the input level should result in an increase of xdB in the output level, if the response is linear. By doing this with short 53 Hz sine bursts input into the sub, starting at 2.83Vand plotting the delta changes between input (say in 0.5db steps) and output (as measured by an RTA in peak capture mode) on a graph as I increase the input level, I should be able to tell where the response goes non-linear, and by how much.
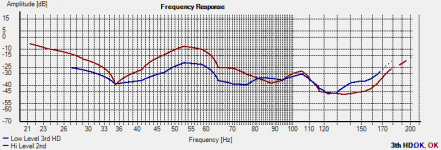
Well, that was a big fail. I couldn't get any measurements that made sense. Too much background noise (that's what I get for living at the end of a road that's aptly-named "Windy Trace"). And close-miking the TH only resulted in the mic getting overloaded as soon as I hit the TH with over 1V.
Grr...
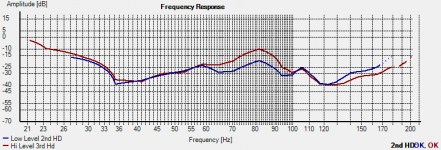
I did manage to get two interesting measurements though. All the time I was looking at THD. This time I chose to look at 2nd HD and 3rd HD. All else being equal, 3rd HD would start to significantly increase when Xmax is exceeded, and I think I obtained a measurement that indicated that. What I wasn't expecting was the increase in 2nd HD at the upper minimum excursion point. I'm not sure why that's happening...
Attachments
- Status
- This old topic is closed. If you want to reopen this topic, contact a moderator using the "Report Post" button.
- Home
- Loudspeakers
- Subwoofers
- HornResp power-handling sims - response vs. reality