I had been using impedande and impedance phase graph for tuning the port. My understanding about the graph is very limited. All I know is if you see a third hump then its resonance because of box, and it might be because of leakage.
But while tryng out with WinISD, I noticed that the peak of the two humps are always equal.Is it important or what it says? Also,what more does this graph speaks.
But while tryng out with WinISD, I noticed that the peak of the two humps are always equal.Is it important or what it says? Also,what more does this graph speaks.
I had been using impedande and impedance phase graph for tuning the port. My understanding about the graph is very limited. All I know is if you see a third hump then its resonance because of box, and it might be because of leakage.
But while tryng out with WinISD, I noticed that the peak of the two humps are always equal.Is it important or what it says? Also,what more does this graph speaks.
It's a decent question. The impedance graph can tell you a lot of things about your built speaker.
For example, if the "humps" are in the right position, but the higher one seems to be much lower than predicted, and there are some ripples in the response around it, then this suggests that the box is not properly braced.
I'm sure the other experts here can add their own observations
") .
.The impedance response is usually the FIRST measurement I take of any of my DIY systems.
As far as I know, the impedance curve closely reveals the motion of the cone (at least below maybe 1kHz). And that's that. And that is why motional feedback using the voice coil achieves such wonders.
However, the output of a speaker can be more than the motion of the cone. I'm prepared to say it is a mistake to build any speaker where there is much disjoint between the cone motion and the sound.
The worst example of that would be the bass-reflex box with TH taking second-bad place.
Traditional tuning of BR is to have the box resonance poison the exact resonance of the driver-in-that-box. Which, in the traditional theory, leaves a two-humped camel-like impedance curve with a gap in cone motion right at that resonance frequency. (Nobody says you must adhere to the tuning prescribed by the traditional theory, but that's the theory.)
Sometimes you follow models and yet are off in your guess of where the resonance of the box or the driver-in-the-box turns out to be. So much for models. When you have the camel-curve, you have a traditionally tuned BR.
Hope that helps, even if it hurts the feelings of BR and TH enthusiasts.
Ben
Last edited:
As far as I know, the impedance curve closely reveals the motion of the cone (at least below maybe 1kHz).
Not really. Otherwise the impedance curve for a sealed alignment would not have a peak. It would have a curve that increases as frequency decreases.
Not really. Otherwise the impedance curve for a sealed alignment would not have a peak. It would have a curve that increases as frequency decreases.
It does have a peak. Right at system resonance. Smaller in size and higher in frequency than in free air.
B.
Thanks for the reply,
Well, The box's bad bracing. This should affect the resonance graph of Port as well the driver resonance, because the the port resonance and driver resonance are generated in combination with the box. So can we say, the box resonance shows its effect in the captured graph.
Is there any thing like a "Q" of the port tube? that is reflected on the resonance graph of port? I mean if the port width is varied (of-course the length too needed for tuning to the required frequency) .
I built kls3 with adjustable port length.
I tuned it so that the double hump of the relex ended up with the same impedance/height.
It did not sound right.
I shortened the ports slightly to make the lower frequency impedance lower than the higher frequency impedance.
It now sounded "more right".
I tuned it so that the double hump of the relex ended up with the same impedance/height.
It did not sound right.
I shortened the ports slightly to make the lower frequency impedance lower than the higher frequency impedance.
It now sounded "more right".
It does have a peak. Right at system resonance. Smaller in size and higher in frequency than in free air.
B.
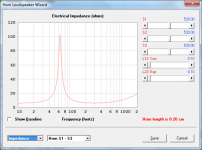
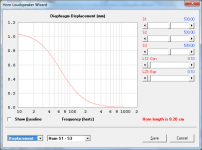
Model a driver in a sealed alignment Qb=0.5
Have a look at the driver excursion
Have a look at the impedance response
One has a peak. The other does not.
Model a driver in a sealed alignment Qb=0.5
Have a look at the driver excursion
Have a look at the impedance response
One has a peak. The other does not.
Ummm, you gotta fix your model, eh.
B.
I built kls3 with adjustable port length.
I tuned it so that the double hump of the relex ended up with the same impedance/height.
It did not sound right.
I shortened the ports slightly to make the lower frequency impedance lower than the higher frequency impedance.
It now sounded "more right".
If I am not mistaken, that is the "non-traditional" tuning that Altec used in speakers like "The Voice of the Theater."
We need to distinguish what produces a great full-sounding bass from what makes a nice mic-tested curve. Frankly, a speaker with extra oomph at 45 Hz will sound better than a kind of flat speaker that goes lower. That's what your re-tuning produced. Not good to have flat bass, as many discussions here have revealed.
Great deal of mistaken belief that there's much on music recordings below 45 (occasional organ recordings excepted) or that 20-20k flat sounds right. Neither is true.
Ben
Last edited:
Ummm, you gotta fix your model, eh.
B.
Then David's HornResp model must need fixing as well
See below screen captures for impedance and displacement for a Qb=0.5 enclosure for the Dayton PA310. I'm interested in how one is supposed to be "following" the other when clearly one has a peak at Fb and the other does not.
Attachments
If I am not mistaken,
You are mistaken.
Thanks for the reply,
Well, The box's bad bracing. This should affect the resonance graph of Port as well the driver resonance, because the the port resonance and driver resonance are generated in combination with the box.
Bad bracing should only affect the magnitude of the impedance graph at the peaks, not the resonance point. In other words, Fb won't change.
You are mistaken.
While we ALL can admire your great masculine assertiveness and forthrightness, perhaps you could spare us a moment to clarify further on your great knowledge of the tuning of the Altec Voice of the Theater system (granted, it is a hybrid)?
Thanks a million for your courtesy.
(... and I really wish a knowledgeable person would pop in here about the impedance peak in sealed boxes.)
Ben
Last edited:
While we ALL can admire your great masculine assertiveness and forthrightness, perhaps you could spare us a moment to clarify further on your great knowledge of the tuning of the Altec Voice of the Theater system (granted, it is a hybrid)?
Thanks a million for your courtesy.
(... and I really wish a knowledgeable person would pop in here about the impedance peak in sealed boxes.)
Ben
I couldn't care less about the "Altec Voice of the Theater" system. I was replying to your assertion that somehow the tuning you referred to is "non-traditional". It's an uninformed assertion, like that one you made about the excursion "following the impedance curve" for example, which was not only uninformed, but clearly wrong.
I shortened the ports slightly to make the lower frequency impedance lower than the higher frequency impedance.
Are you sure you've got that the correct way around? I think shortening the ports should actually decrease the height upper impedance peak.
(... and I really wish a knowledgeable person would pop in here about the impedance peak in sealed boxes.)
Ben
you have got to be KIDDING!!!!
Brian laid it all out for you! You're trying to make it sound like we need a triple-PhD Theoretical Astrophysicist to assist us in some wild-eyed claim that you made about the impedance graph being some mystical entity! For the love of all that is acoustic----the impedance graph does not in any way shape or form have a direct mapping into the excursion plot of anything. This is known to everyone but the newest of newbies. 
Are you sure you've got that the correct way around? I think shortening the ports should actually decrease the height upper impedance peak.
@ Brain & Andrew,
I know you have better experience and knowledge than me. I am making some things clear so that there are no ambiguity.
The tuned frequency is the one where the impedance phase graph shows zero degrees, & between the two humps of impedance.
The meaning of shorter port mean, shorter in length not in diameter, right?
So if you change the length its diameter too changes. and you also have to adjust volume to compensate the volume that was covered by port. else the tuning frequency Fb would change correct? Was it achieved this way or the Fb was allowed to shift?
The tuned frequency is the one where the impedance phase graph shows zero degrees, & between the two humps of impedance.
Correct. If I may, this is the actual impedance measurement of a ported enclosure of mine:
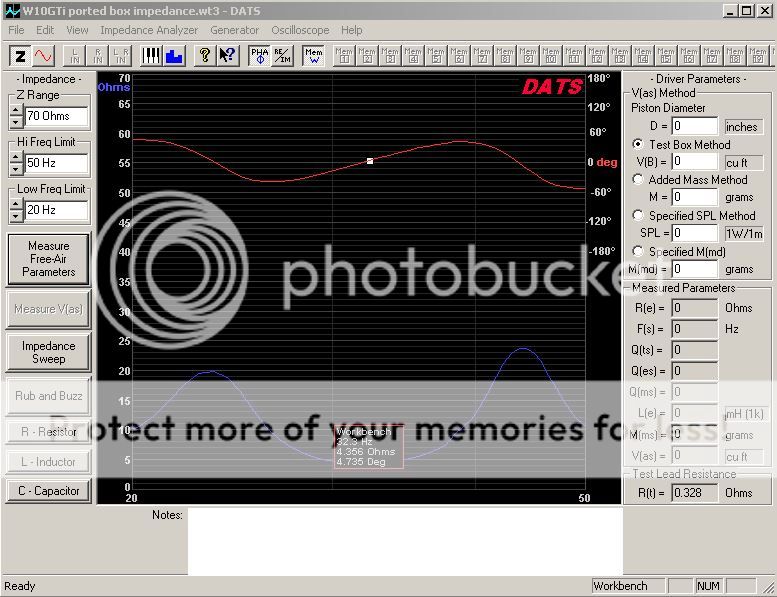
As you can see, there are three zero-phase points, but only one represents the tuned frequency--the one that corresponds with the local minima right in between the two impedance peaks, as you said.
- Status
- This old topic is closed. If you want to reopen this topic, contact a moderator using the "Report Post" button.
- Home
- Loudspeakers
- Subwoofers
- understanding Impedance graph.