What is the resolution of the frequency graph? Is there a way to adjust the resolution so it is not so smooth when evaluating frequencies?
Hi OMNIFEX,
Not sure that I understand
") . Hornresp calculates the frequency on a logarithmic scale at every horizontal pixel position on the display screen, so that the chart resolution is the same as that of the screen - there is no smoothing, as such. If you export the calculated results you can see the actual frequencies being used, for your computer. The usual frequency point total for a standard display screen resolution is 533.
. Hornresp calculates the frequency on a logarithmic scale at every horizontal pixel position on the display screen, so that the chart resolution is the same as that of the screen - there is no smoothing, as such. If you export the calculated results you can see the actual frequencies being used, for your computer. The usual frequency point total for a standard display screen resolution is 533.Kind regards,
David
+1, hint, hint
Best regards Johan
Hi Johan,
As I have said on numerous occasions - it's not going to happen
.Kind regards,
David
Hornresp calculates the frequency on a logarithmic scale at every horizontal pixel position on the display screen, so that the chart resolution is the same as that of the screen - there is no smoothing, as such.
Just to clarify - this is the case when the display screen text size is set to 100%.
Strictly speaking, I guess there will be a very slight apparent "smoothing" effect if a larger text size setting is used, because the whole chart will be shown bigger on the screen.
Kind regards,
David
Hi OMNIFEX,
Not sure that I understand
Kind regards,
David
Hi David.
When I measure the frequency response of my subs, I set the FFT to 32768. This gives me a resolution of 1.35 Hz.

This reduces the smoothing from 100 Hz - 20 Hz and gives me more information as appose to having a higher FFT setting.
To make a fair comparison, can you tell me the resolution of horn response within 100 Hz to 20 Hz so I can configure the FFT on my measurement program to match the resolution of horn response to see how well horn response results will match the results of the measured response.
Cheers!
Last edited:
You may be measuring to 1.35 Hz resolution, but the displayed result depends on the resolution of your screen. As an extreme example, you may have 1000 measured values between 20 Hz and 100 Hz. But if your result graph has only 100 pixels between the 20 Hz and 100 Hz graph lines, that's all the resolution you are going to see.
It's like displaying a picture from a digital camera on a PC screen - the picture might have 3000 x 2000 pixels, but if your display is only 1280 x 1024 you're not going to see all the detail that is in the image.
If I understand David correctly, Hornresp uses variable resolution. It samples at the frequency corresponding to each screen pixel of the result graph. For example, the range 20 Hz to 100 Hz is displayed on a logarithmic scale. There might be 100 pixels between 20 Hz and 30 Hz, so the resolution is 0.1 Hz. But there might be only 10 pixels between 90 Hz and 100 Hz, so the resolution is 1 Hz.
Last edited:
You may be measuring to 1.35 Hz resolution, but the displayed result depends on the resolution of your screen. As an extreme example, you may have 1000 measured values between 20 Hz and 100 Hz. But if your result graph has only 100 pixels between the 20 Hz and 100 Hz graph lines, that's all the resolution you are going to see.
It's like displaying a picture from a digital camera on a PC screen - the picture might have 3000 x 2000 pixels, but if your display is only 1280 x 1024 you're not going to see all the detail that is in the image.
I have never had that issue you are mentioning. I tend to limit the dB range in addition to use very long sweeps so I would imagine that is why I attain a detail response.
Basically. You may well take 32000 or so samples. But your graph won't be showing that detail unless you have a screen that is 32000 pixels wide (which you don't!)
I'm not sure what frequency interval David has set horn resp to calculate but it seems to be a fairly high resolution. It sounds like it is different depending on the size of your screen/graph.
I'm not sure what frequency interval David has set horn resp to calculate but it seems to be a fairly high resolution. It sounds like it is different depending on the size of your screen/graph.
Basically. You may well take 32000 or so samples. But your graph won't be showing that detail unless you have a screen that is 32000 pixels wide (which you don't!)
If you are measuring a loudspeaker's frequency response under limited bandwidth, with a limited dB scale, using a slow sweep, I can assure you, there will be a difference in the detail using an FFT scaling of 16384 oppose FFT scaling 4096.
However, if you are using a fast sweep, chances are you will not notice a difference in detail. The key is the duration of the sweep that you are using.
I do not use fast sweeps, I use slow sweeps.
Cheers!
Measuring the response of a speaker using a sweep tone is so... last century. The point is still valid though, regardless of the resolution of your measurements, if they exceed the resolution of the output device you won't see them all.
But to answer your original question, Hornresp graphs from 10 Hz to 20 KHz. On my system, there are 49 pixels between 10 and 20 Hz. That's an approximate resolution of about 0.2 Hz per point... for 90 Hz to 100 Hz, there are 7 pixels, that's about 1.4 Hz per point. So the resolution of Hornresp is similar to or better than your measurements at low frequencies. Differences between Hornresp and your measurements will be due to the differences in the models that Hornresp and Eminence Designer use. From my initial examination, ED appears to use the standard lumped constant box model.
The point is still valid though, regardless of the resolution of your measurements, if they exceed the resolution of the output device you won't see them all. But to answer your original question, Hornresp graphs from 10 Hz to 20 KHz. On my system, there are 49 pixels between 10 and 20 Hz. That's an approximate resolution of about 0.2 Hz per point... for 90 Hz to 100 Hz, there are 7 pixels, that's about 1.4 Hz per point. So the resolution of Hornresp is similar to or better than your measurements at low frequencies. Differences between Hornresp and your measurements will be due to the differences in the models that Hornresp and Eminence Designer use. From my initial examination, ED appears to use the standard lumped constant box model.
Last edited:
If I understand David correctly, Hornresp uses variable resolution. It samples at the frequency corresponding to each screen pixel of the result graph. For example, the range 20 Hz to 100 Hz is displayed on a logarithmic scale. There might be 100 pixels between 20 Hz and 30 Hz, so the resolution is 0.1 Hz. But there might be only 10 pixels between 90 Hz and 100 Hz, so the resolution is 1 Hz.
Hi Don,
You understand correctly. To hopefully make things a bit clearer for everyone, I have attached a list of the frequencies used by Hornresp on my computer, over the range 10 Hz to 100 Hz. A full list up to 20000 Hz can be obtained by exporting the chart results data.
I saw no reason for Hornresp to have more frequency points for charting purposes than could be displayed on the monitor screen. It is of course possible to calculated the results at other specific frequencies if desired, using the Sample tool.
Kind regards,
David
Attachments
Hi guys,
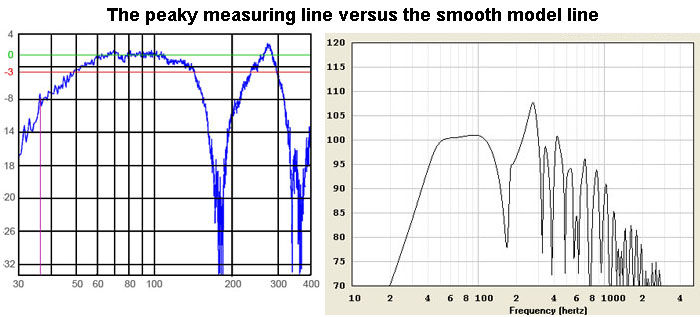
Maybe Omnifex means something different than screen resolution. Maybe he refers to the difference between real live measurement and the ideal world of sims. Models don't suffer from losses, abnormalities or deviations, such as; boundary effects, fluctuations in driver parameters and material characteristics, absorption, panel flexing and so on and on....That means the read out looks like smoothed out, since it is 'perfect'.
Real live measurements measure all the small differences in values, including that of influences of the environmental circumstances and errors of the measuring system (mic, converters and so on), the losses and deviations that all give the read out (in high resolution and without smoothing) a peaky read out that isn’t anywhere as 'perfect' like in the ideal simming world...
Last edited:
...The original Hornresp program was written before Messrs Thiele and Small came up with their filter-based parameters anyway
Neville Thiele passed away at the beginning of October. He was 92.
hi jim
i was thinking the same.
his work lives on.
92 jrs old ,where can i sign for that
i was thinking the same.
r.i.p.Neville Thiele passed away at the beginning of October. He was 92.
his work lives on.
92 jrs old ,where can i sign for that
Hi guys,
Maybe Omnifex means something different than screen resolution. Maybe he refers to the difference between real live measurement and the ideal world of sims. Models don't suffer from losses, abnormalities or deviations, such as; boundary effects, fluctuations in driver parameters and material characteristics, absorption, panel flexing and so on and on....That means the read out looks like smoothed out, since it is 'perfect'.
Real live measurements measure all the small differences in values, including that of influences of the environmental circumstances and errors of the measuring system (mic, converters and so on), the losses and deviations that all give the read out (in high resolution and without smoothing) a peaky read out that isn’t anywhere as 'perfect' like in the ideal simming world...
Exactly.
It is those imperfections that many in the pro audio world wants to see so they know exactly what to expect to apply equalisation if or when necessary.
Last edited:
Anyone who is trying to EQ out 0.1dB fluctations in a speakers frequency response is, quite frankly, deluded.
IMO fluctuations up to around 3dB aren't worth bothering with. The microphone that recorded the music, your room and your ear will all be far more influential than these small fluctuations.
The latest (waveguide based) modelling software packages (HornResp, MJK etc.) provide more than enough detail IMHO.
thats imposible to simulate ,like jim says,there are so many variable.
even between the same speakers there are deviations.
Absolutely. Which is why I was asking what is the FFT resolution of Horn Response graph. This will enable me to match the resolution of horn response graph to my measurement software FFT graph so I can make a fair comparison amongst the two.
I'm hearing many saying this and that and could not tell me the FFT resolution Horn's response graph.
Hi Don,
You understand correctly. To hopefully make things a bit clearer for everyone, I have attached a list of the frequencies used by Hornresp on my computer, over the range 10 Hz to 100 Hz. A full list up to 20000 Hz can be obtained by exporting the chart results data.
I saw no reason for Hornresp to have more frequency points for charting purposes than could be displayed on the monitor screen. It is of course possible to calculated the results at other specific frequencies if desired, using the Sample tool.
Kind regards,
David
Cheers David!
Your attached text is exactly what I was inquiring about so, I can match the resolution of Horn Response to my measurement software in order to make a fair comparison.
Last edited:
What I am planning to do is compare the results of Horn Response to the measured results of the software analyser I am using to measure the frequency curve of the sub. In order to make a fair comparison, I wanted the FFT resolution of Horn Response so I can match the resolution of the software analyser to Horn Response’s FFT resolution.
I am not expecting the end results to match perfectly. I will be determining how close Horn Response’s simulated curve is to the software analyser’s curve. As I am already familiar on how close Eminence Designer matches the curve of my designs, if Horn Response’s curve is closer to the software analyser’s curve, it will tell me Horn Response offers a higher percentage on matching the measured results of the software analyser than Eminence Designer.
As I have contacted Harris tech (The developer of Eminence Designer) over a decade ago to confirm if the measured results in Eminence Designer from 100 Hz downwards is based on half space, 1 metre, I would imagine Horn Response is basing its results from 100 Hz downwards @ 1 metre half space as well.
So it is a matter of placing the microphone 1 metre away from the sub while, having the sub away from any boundaries to ensure it is half space, to make a fair comparison.
Cheers!
Last edited:
- Status
- This old topic is closed. If you want to reopen this topic, contact a moderator using the "Report Post" button.
- Home
- Loudspeakers
- Subwoofers
- Differents results from differents simulation sofware