Hi,
I have just finished my software, and would like to get more feedback on it.
Speakerbuilder Pro 2.0
Is the layout good?
Does it do what you need?
Does it look good in exotic browsers like Internet Explorer too?
And so on....")
Hope youll help making this even better, by applying your feedback.
I have just finished my software, and would like to get more feedback on it.
Speakerbuilder Pro 2.0
Is the layout good?
Does it do what you need?
Does it look good in exotic browsers like Internet Explorer too?
And so on....
Hope youll help making this even better, by applying your feedback.
It seems to be working okay.
It seems to follow the same predictions as Winlsd on my latest subwoofer box using 3 X 8" PRO-CSW800 Radio Shack subwoofers in a 3 cu.ft. box tuned to 26hz.
The ports seem to be the correct length at about 2 X 4"dia X 33"L.
I am using Chrome ver14 right now and it is the Bomb compared to IE8.
I would like to see a group delay chart and maybe a spl output chart.
I like the idea of seeing all of the charts at the same time when I make a change of a parameter,Winlsd does not do this.
Great job and keep up the good work!
I will play with it some more and let you know when I come up with some more idea's for you to implement.
jer
Last edited:
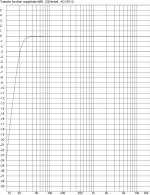
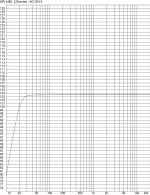
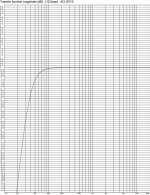
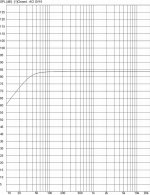
The Spl out when driven by the signal.
Maybe ireleavent, But Winlsd does this and is good to show when comparing number of drivers to excursions.
Where as the transfer curve is the frequency response and spl would show the theoretical output curve as per power in.
Although this can easily be calculated in the head but seeing the graph with the numbers some times gives you a different perspective on what you should expect to hear and/or experience.
jer
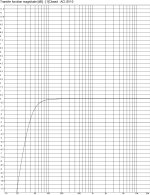
like this example.
Had I changed the scaling the curves would look a little different.
I just did this quick and then I had to find a .xps to .jpg converter,What a pain!
But maybe you will get what I am saying.
Either way I like your program alot.
jer
Had I changed the scaling the curves would look a little different.
I just did this quick and then I had to find a .xps to .jpg converter,What a pain!
But maybe you will get what I am saying.
Either way I like your program alot.
jer
Attachments

Hi,
I have just updatede the app with new graphs for closed box. Now it has impedance and Group delay.
Im hoping to get Group delay and Impedance for reflex finished as soon as possible.
Speakerbuilder Pro 2.0
I have just updatede the app with new graphs for closed box. Now it has impedance and Group delay.
Im hoping to get Group delay and Impedance for reflex finished as soon as possible.
Speakerbuilder Pro 2.0
- Status
- This old topic is closed. If you want to reopen this topic, contact a moderator using the "Report Post" button.
- Home
- Loudspeakers
- Subwoofers
- Feedback needed