Here's something to look at:
1. Blue - POC3 TH on a table, ~3 feet off the ground
2. Red - POC3 TH on the floor, center of the room
Fb dropped by 3% (based on the raw data, it's not that visible in the graph), and there's a noticeable drop in the impedance peak in the middle of the passband.
...and here's another measurement to look at:
1. Blue - POC3 TH on a table, ~3 feet off the ground
2. Red - POC3 midway along a wall, with the horn's mouth located at the intersection of the wall and the floor.
Fb interestingly has gone back up, but now there are noticeable changes in the impedance curve up to almost 300 Hz, and significantly around the middle peak, which has shifted downwards in both magnitude and frequency.
Concerning Fb, I had a look at the raw data and there's basically fractions of an ohm separating the impedance measurements around that frequency, and there are only a few data points in that area, e.g. see actual data below for one of the measurements (Hz / Ohms / Phase).
36.971 5.958 -7.908
38.055 5.942 -2.412
39.170 5.972 3.854
40.317 6.075 7.746
I'm running DATS v1.0.2. I understand DATS v2.0 may offer a lot more data points, so perhaps its time to upgrade...
")
Attachments
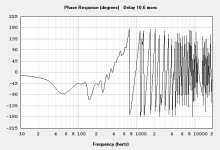
...and finally here's two graphs, showing (1) a comparison between HornResp's sim at 4PI and the measurement taken with the TH off the ground, and (2) a comparison between HornResp's sim at 1PI and the TH placed along the wall.
Attachments
Brian,...and finally here's two graphs, showing (1) a comparison between HornResp's sim at 4PI and the measurement taken with the TH off the ground, and (2) a comparison between HornResp's sim at 1PI and the TH placed along the wall.
So, as Hornresp predicted, there are minor variations in a cabinet's impedance dependent on boundary loading conditions.
Was that a surprise to you?
Art
Brian,
So, as Hornresp predicted, there are minor variations in a cabinet's impedance dependent on boundary loading conditions.
Was that a surprise to you?
Art
Nope. See my previous posts in this thread on this subject.
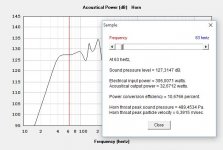
Duo to bad weather (for weeks now) still could not properly do outside measurements of the TH18 with the Oberton 18XB800. Although hornresp simulates pretty good response curve. The Xmax its reached at around 62v for this particular driver.
What do you guys think? (sim at 60v)
What do you guys think? (sim at 60v)
Attachments
Last edited:
@Brian Steel,Interesting results.
Are you able to do an impedance curve measurement? That will quickly tell how close you got to the sim of the TH18, and if there are any glaring issues with the build. The FR curve looks pretty decent - can you repeat the measurement @ 2.83V, with the mic placed 1M from the subwoofer's mouth?
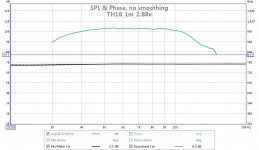
Ok so finally able to do some more measurements on a Xoc1 TH-18.
1. 1m/2.83v.
Method: Outdoor on grass with at least 20 meters to any buildings/walls/ boundaries. With the mic placed on the ground on a 2 cm high piece of wood to get it out of the grass.
(The reference db scale is not 100% excact because I had difficulties calibrating the mic with pink noise which is the only option in REW?)
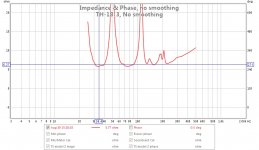
2. Impedance measurement using REW with the TH-18 standing on in a corner.
/Best Andy
Attachments
@Brian Steel,
Ok so finally able to do some more measurements on a Xoc1 TH-18.
1. 1m/2.83v.
Method: Outdoor on grass with at least 20 meters to any buildings/walls/ boundaries. With the mic placed on the ground on a 2 cm high piece of wood to get it out of the grass.
(The reference db scale is not 100% excact because I had difficulties calibrating the mic with pink noise which is the only option in REW?)
2. Impedance measurement using REW with the TH-18 standing on in a corner.
/Best Andy
Hi Andy,
Did you save your measurement files? If could I have a copy to look at? I'm sure there are others interested if you could zip it up and host it somewhere, if that's not possible I could if you can e-mail it to me.
@Sabbelbacke,@Andy
Thanx. very interesting. Was there some filtering involved? Which driver and which cab-version did u use?
Driver is B&C18SW100 and filters: HP 30/48db BW and LP 100/48db BW
TH18 cab is version 1 with cone correction from Djim.
Regards, Andy
Last edited:
Hi Dan,Hi Andy,
Did you save your measurement files? If could I have a copy to look at? I'm sure there are others interested if you could zip it up and host it somewhere, if that's not possible I could if you can e-mail it to me.
First time using Dropbox share, hope it works.
TH18_REW
There should be two sets of REW measurements in there. Sensitivity and impendance measurements.
Comments are welcome.
Best, Andy
@Brian Steel,
Ok so finally able to do some more measurements on a Xoc1 TH-18.
1. 1m/2.83v.
Method: Outdoor on grass with at least 20 meters to any buildings/walls/ boundaries. With the mic placed on the ground on a 2 cm high piece of wood to get it out of the grass.
(The reference db scale is not 100% excact because I had difficulties calibrating the mic with pink noise which is the only option in REW?)
2. Impedance measurement using REW with the TH-18 standing on in a corner.
/Best Andy
Great, thanks for this Andy.
As Dan mentioned, do you keep the measurement files? I'd like to see them, particularly to see how the measurements compared to the simulated results.
Out of interest, I think it would be great to see what the FR looks like without the filtering.
On the impedance measurement, for best accuracy (e.g. to compare to the HornResp sim), based on my own tests the TH should be on the ground and at least one mouth's diameter away from any wall or other surface that can "load" the mouth and shift Fb. From the graph you gave, it looks like there's some sort of resonance occurring at 35 Hz, 67? Hz and 83? Hz, which could be caused by room modes (seeing that the measurement was done with the TH in a corner), though the usual culprit is panel flex.
Hi Dan,
First time using Dropbox share, hope it works.
TH18_REW
There should be two sets of REW measurements in there. Sensitivity and impendance measurements.
Comments are welcome.
Best, Andy
Hmm... those seem to be in some weird MDAT format. Can REW export to one of the standard formats, e.g. ZMA for the Impedance data?
@Sabbelbacke,
Driver is B&C18SW100 and filters: HP 30/48db BW and LP 100/48db BW
TH18 cab is version 1 with cone correction from Djim.
Regards, Andy
Hy Andy,
thank you.
Do you have an idea why the drop-off from 40Hz to 30Hz occurs? If I put the 18SW100 in the sim, the Cab should be able to put out around 95db at 30Hz - in your measurement it drops about 10db from 40 to 30 Hz...
Hi Sabbelbacke,Hy Andy,
thank you.
Do you have an idea why the drop-off from 40Hz to 30Hz occurs? If I put the 18SW100 in the sim, the Cab should be able to put out around 95db at 30Hz - in your measurement it drops about 10db from 40 to 30 Hz...
I have not seen the sim with my driver actually. Hornresp is new to me. Could you share the parameter input in a screen shot, if you still have it readily available?
The cab is called flat to 35, but I always got the impression that it would mean referencing to lower f3 so -3db at 35hz.
Then add the HP filter at 30hz 48db BW.
I did make test of the impact of the HP filter but unly down to 35hz and I didn't notice any difference in the output then. Measurements including 30hz I gues the HP filter would start kicking in but I don't know with how many db's
Further, the mic (XTA)- even though I am using a calibration file that I found on the internet, - I cannot make any guaranties that it is 100% correct.
With the impedance measurments showing it has the correct fb - it seems, I don't know where else to look for missing low end, but in the DSP,amp or the measurments themselves. All ideas are welcome.
What I can do, is make some fixed freq. measurements with my c weighted SPL meter.
There is also the discussion on how to actually find the lower f3. I am somehow leaning on a general avg. 100db sensitivity with 2.83v for my cab.
Regards, Andy
Hi Andy,
I am not at the PC right now, but I can share input data etc. later. As I remember, the 18SW100 sims very well in the XOC TH18 cab.
One idea where the cause could be: Is the 30Hz/48dB Highpass a butterworth or a l/r filter? If it´s a L/R, this might be the cause, since it tends to cut more in the sideband than a butterworth filter.
@Andy
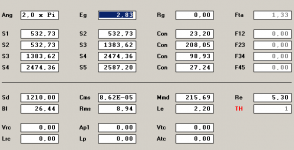
Some time to spare...
I used this (B&C 18SW100 8Ohm)

then exported SPL and IMP into REW, loaded your files provided above and overlayed them:

As I recall, you measured the IMP in a corner, my sim was 2Pi - but when put in a corner, the peeks should be lower anyways. They are higher in your measurement then in the sim (which is groundplane)..
BTW: 48db/30Hz BW Filter doesn´t do much to the lower end - there must be something else going on.
Some time to spare...
I used this (B&C 18SW100 8Ohm)
then exported SPL and IMP into REW, loaded your files provided above and overlayed them:
As I recall, you measured the IMP in a corner, my sim was 2Pi - but when put in a corner, the peeks should be lower anyways. They are higher in your measurement then in the sim (which is groundplane)..
BTW: 48db/30Hz BW Filter doesn´t do much to the lower end - there must be something else going on.
Attachments
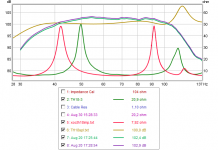
Thanks Andy. I overlaid your impedance measurement on the HornResp prediction for a v1 TH18 with a little "ratch" to account for the cone correction and the result was the attached.
1. Lowest impedance peak is higher in frequency than the sim - this is normal (occurs in every measurement I've done so far). If it is too much higher though, that suggests that there's a leak, usually around the driver. This will be reflected in lower output at the lower end of the passband.
2. Middle impedance peak is higher in magnitude than the sim - this is unexpected, and suggests either an issue with the measurement technique, or the driver's actual t/s params don't match the published ones, or the HornResp sim isn't a good match the built box. The measured peaks should always be lower than the sim'd ones (box losses). The middle impedance peak is also slightly lower in frequency than the sim suggests, another sign that the HornResp model is slightly off.
3. Corrupted impedance peak @200 Hz. This is likely due to panel resonance. It's well outside the passband, so I wouldn't worry about it. It's more important to get the three main impedance peaks nice and clean, with no ripples in-between and around them.
If you can export the frequency response data to a text file, I can analyze that as well.
Attachments
- Home
- Loudspeakers
- Subwoofers
- TH-18 Flat to 35hz! (Xoc1's design)