Purpose:
I suppose many of you knew this already, but it's not something I see written about a lot in these forums. The last mention of this was in May 2008, and the thread has only 3 posts with one person writing that driver orientation "makes no difference". So I hope that other novice subwoofer designers will benefit from my experiments.
Methods:
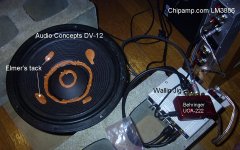
The Audio Concepts DV-12 was used. This is a 12" paper cone, dual voice coil (8ohm + 8ohm) woofer designed for sealed cabinets. I believe the Audio Concepts kits (Orion and Saturn?) used it in a downward-firing position. SpeakerWorkshop by Audata was used for data collection, T/S parameter estimation, and box simulation. A ChipAmp.com LM3886 kit was used for power at ~0.5VAC. A Wallin Jig and Behringer UCA-222 was used to interface with the software.
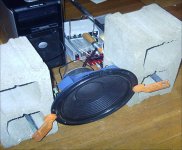
Two identical drivers were tested using the free-air and added-mass methods in three orientations: facing up, facing down, and sideways. Each voice coil of each driver was tested separately, as well as both coils in parallel. The first photo shows the test setup with driver facing upward, mass-loaded. Second photo shows sideways, unloaded testing.
Results:
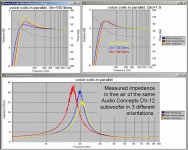
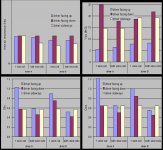
The bottom graph in the third figure shows the unloaded impedance curves of one of the drivers (using both coils in parallel), facing up, down, and sideways. The top left graph shows simulated frequency-response curves of the same driver (again, both coils in parallel) keeping the box volume constant at 150 liters, undamped. Speaker workshop does not allow easy calculation of Qtc for a given Vb, so Qtc values are not shown. The top right graph shows simulated frequency-response curves of the same driver (again, both coils in parallel) keeping the Qtc constant at Qtc=1.0 liters. The color-coded Vb values are undamped volumes necessary to achieve a Qtc of 1.0.
The fourth figure is a chart showing all T/S parameters calculated by SpeakerWorkshop for most conditions tested. Data for only one of the two voice coils is shown because parameters for the two coils are similar. The 5th figure is simply a graph of selected data in said chart. It can’t be seen, but Fs is plotted on a log scale. Data for Qes is included (lower right) to show that it correlates closely with Qts. Qms, conversely, did not vary with driver position (data in chart, but not graphed). Note that Qts is derived from Qes and Qms, so would seem that the effect of driver orientation on Qts is due to its effect on electrical, rather than mechanical Q.
Conclusion:
Driver orientation affected driver T/S parameters whether using one, or both, voice coils. In addition, all three orientations differed from the other two. Changing driver orientation from sideways to facing up more than halved the box volume necessary to achieve a given Qtc when both coils were used in parallel. The magnitude of the effect of driver orientation on behavior suggests that subwoofer designers would do well to consider all orientations of drivers, and that T/S parameters should be measured and used for the orientation in which the woofer will be used.
Note that the Audio Concepts DV-12 has an especially heavy cone designed for low Fs. It would be interesting to know if a driver with a lighter cone, designed for a vented/PR enclosure, shows the same dependence on orientation. This will probably be discovered in an additional, similar post!
I suppose many of you knew this already, but it's not something I see written about a lot in these forums. The last mention of this was in May 2008, and the thread has only 3 posts with one person writing that driver orientation "makes no difference". So I hope that other novice subwoofer designers will benefit from my experiments.
Methods:
The Audio Concepts DV-12 was used. This is a 12" paper cone, dual voice coil (8ohm + 8ohm) woofer designed for sealed cabinets. I believe the Audio Concepts kits (Orion and Saturn?) used it in a downward-firing position. SpeakerWorkshop by Audata was used for data collection, T/S parameter estimation, and box simulation. A ChipAmp.com LM3886 kit was used for power at ~0.5VAC. A Wallin Jig and Behringer UCA-222 was used to interface with the software.
Two identical drivers were tested using the free-air and added-mass methods in three orientations: facing up, facing down, and sideways. Each voice coil of each driver was tested separately, as well as both coils in parallel. The first photo shows the test setup with driver facing upward, mass-loaded. Second photo shows sideways, unloaded testing.
Results:
The bottom graph in the third figure shows the unloaded impedance curves of one of the drivers (using both coils in parallel), facing up, down, and sideways. The top left graph shows simulated frequency-response curves of the same driver (again, both coils in parallel) keeping the box volume constant at 150 liters, undamped. Speaker workshop does not allow easy calculation of Qtc for a given Vb, so Qtc values are not shown. The top right graph shows simulated frequency-response curves of the same driver (again, both coils in parallel) keeping the Qtc constant at Qtc=1.0 liters. The color-coded Vb values are undamped volumes necessary to achieve a Qtc of 1.0.
The fourth figure is a chart showing all T/S parameters calculated by SpeakerWorkshop for most conditions tested. Data for only one of the two voice coils is shown because parameters for the two coils are similar. The 5th figure is simply a graph of selected data in said chart. It can’t be seen, but Fs is plotted on a log scale. Data for Qes is included (lower right) to show that it correlates closely with Qts. Qms, conversely, did not vary with driver position (data in chart, but not graphed). Note that Qts is derived from Qes and Qms, so would seem that the effect of driver orientation on Qts is due to its effect on electrical, rather than mechanical Q.
Conclusion:
Driver orientation affected driver T/S parameters whether using one, or both, voice coils. In addition, all three orientations differed from the other two. Changing driver orientation from sideways to facing up more than halved the box volume necessary to achieve a given Qtc when both coils were used in parallel. The magnitude of the effect of driver orientation on behavior suggests that subwoofer designers would do well to consider all orientations of drivers, and that T/S parameters should be measured and used for the orientation in which the woofer will be used.
Note that the Audio Concepts DV-12 has an especially heavy cone designed for low Fs. It would be interesting to know if a driver with a lighter cone, designed for a vented/PR enclosure, shows the same dependence on orientation. This will probably be discovered in an additional, similar post!
Attachments
Nice work. ") A few comments on your methodology and findings though:
A few comments on your methodology and findings though:
Looking at the pictures I'm not sure that you have the driver far enough away from nearby boundaries for the size of woofer to guarentee that you aren't getting some boundary effects, such as mass loading from the floor, which will be present when the driver is horizontal not far above the floor, but absent when the driver is vertical.
This effect alone could cause a signficant lowering of the Fs when the driver is horizontal, especially when it's facing downwards with the cone closer to the floor. From that, it's likely that the reading taken when vertical is closest to the correct value, although it may still be influenced by the proximity of the bricks as well.
My favoured method of measuring T/S parameters of a large woofer is to hang the woofer from a strong rope or steel chain through one of it's mounting holes so that it's a metre away from the nearest boundary, thus avoiding any proximity effects. Even mounting the driver on a large test baffle is going to affect the measured T/S parameters.
The other thing is that what you've probably stumbled across is the non-linear effects of the suspension which can have a significant effect on compliance (and therefore Fs and Qms) depending on excursion of the driver, as well as short term "memory effect" of the suspension material.
It's not generally known but suspension compliance of a driver varies considerably depending on excursion, from micro-movements through visible movement up to Xmax, so depending on what drive level you test at you'll get a completely different Cms value, and therefore different Fs and Qms which are both related to Cms. In that sense, there is no one "correct" set of T/S parameters for a driver, because they change with excursion down to very tiny excursions.
Counter intuitively the suspension is stiffest for extremely miniscule movements and gets progressively softer and more compliant as excursion is increased, (causing Fs to drop with increased excursion) up until the point where you start reaching Xmax where it will get stiffer again.
It's not a small change either, on some drivers the difference can be dramatic. This was discussed and debated in great detail in the following thread where I presented some experimental measurements of two different drivers, one a 12" woofer, (with rubber surround) and the other an 8" full range driver with cloth surround: (starting at post 13)
http://www.diyaudio.com/forums/multi-way/182688-help-understanding-physics-vas.html#post2461764
The summary is that the 12" woofer's Fs measured with very low drive levels was 29.5Hz, but dropped down to 24Hz by the time half Xmax was reached. In the case of the full range driver the Fs at very low drive levels was 48Hz, dropping progressively down to 34.5Hz by the time half Xmax was reached - almost a 2 to 1 change in Cms.
Furthermore, in the case of the 12" woofer (I didn't test this with the other driver) there is a memory effect with the suspension - if I tested it at the very low drive level which normally gave an Fs of 29.5Hz, but manually moved the cone back and forth through it's full excursion then let go and immediately measured the Fs, it was down around 24Hz, and gradually crept back up to 29.5Hz over about 10-15 seconds. With a real time impedance curve measuring system (I used noise mode in LIMP in the ARTA package) you can see the impedance curve morph before your eyes.
In your case when you place the driver horizontally the weight of the cone will be enough to stretch the suspension slightly due to the suspension sagging, and this slight stretch will be enough to lower the Fs.
Does it all really matter ? Not much, I think - but it is good to be aware of the fact that although T/S parameters are supposed to be "small signal" parameters, there is a potentially large shift in Cms between a truely small signal and a moderate one, so it's useful to measure it both at a small and larger signal level, and model these two sets of T/S parameters as two opposite extremes, to make sure that an acceptable response rolloff occurs for both
A few comments on your methodology and findings though:Looking at the pictures I'm not sure that you have the driver far enough away from nearby boundaries for the size of woofer to guarentee that you aren't getting some boundary effects, such as mass loading from the floor, which will be present when the driver is horizontal not far above the floor, but absent when the driver is vertical.
This effect alone could cause a signficant lowering of the Fs when the driver is horizontal, especially when it's facing downwards with the cone closer to the floor. From that, it's likely that the reading taken when vertical is closest to the correct value, although it may still be influenced by the proximity of the bricks as well.
My favoured method of measuring T/S parameters of a large woofer is to hang the woofer from a strong rope or steel chain through one of it's mounting holes so that it's a metre away from the nearest boundary, thus avoiding any proximity effects. Even mounting the driver on a large test baffle is going to affect the measured T/S parameters.
The other thing is that what you've probably stumbled across is the non-linear effects of the suspension which can have a significant effect on compliance (and therefore Fs and Qms) depending on excursion of the driver, as well as short term "memory effect" of the suspension material.
It's not generally known but suspension compliance of a driver varies considerably depending on excursion, from micro-movements through visible movement up to Xmax, so depending on what drive level you test at you'll get a completely different Cms value, and therefore different Fs and Qms which are both related to Cms. In that sense, there is no one "correct" set of T/S parameters for a driver, because they change with excursion down to very tiny excursions.
Counter intuitively the suspension is stiffest for extremely miniscule movements and gets progressively softer and more compliant as excursion is increased, (causing Fs to drop with increased excursion) up until the point where you start reaching Xmax where it will get stiffer again.
It's not a small change either, on some drivers the difference can be dramatic. This was discussed and debated in great detail in the following thread where I presented some experimental measurements of two different drivers, one a 12" woofer, (with rubber surround) and the other an 8" full range driver with cloth surround: (starting at post 13)
http://www.diyaudio.com/forums/multi-way/182688-help-understanding-physics-vas.html#post2461764
The summary is that the 12" woofer's Fs measured with very low drive levels was 29.5Hz, but dropped down to 24Hz by the time half Xmax was reached. In the case of the full range driver the Fs at very low drive levels was 48Hz, dropping progressively down to 34.5Hz by the time half Xmax was reached - almost a 2 to 1 change in Cms.
Furthermore, in the case of the 12" woofer (I didn't test this with the other driver) there is a memory effect with the suspension - if I tested it at the very low drive level which normally gave an Fs of 29.5Hz, but manually moved the cone back and forth through it's full excursion then let go and immediately measured the Fs, it was down around 24Hz, and gradually crept back up to 29.5Hz over about 10-15 seconds.
With a real time impedance curve measuring system (I used noise mode in LIMP in the ARTA package) you can see the impedance curve morph before your eyes.In your case when you place the driver horizontally the weight of the cone will be enough to stretch the suspension slightly due to the suspension sagging, and this slight stretch will be enough to lower the Fs.
Does it all really matter ? Not much, I think - but it is good to be aware of the fact that although T/S parameters are supposed to be "small signal" parameters, there is a potentially large shift in Cms between a truely small signal and a moderate one, so it's useful to measure it both at a small and larger signal level, and model these two sets of T/S parameters as two opposite extremes, to make sure that an acceptable response rolloff occurs for both
Thank you, Simon, for the comments. The learning curve is, indeed, steep!
I have a question about your preferred measurement method. Everything I've read on measurement says to tightly constrain the driver during testing, including Vance Dickason's book. But you do the opposite. How do the results differ between hanging a driver from a chain vs. clamping to a test jig? And why do you prefer the hanging method?
Reflections from the floor are something I hadn't seriously considered. I have a test jig which can hold a driver far from reflected surfaces, but chose the method I did because I plan to have the driver similarly close to the floor in the subwoofer I plan to build. So I guess my results still would have applied to my specific application, but can not be generalized to this driver over a variety of applications. After seeing the box volume I would need to get a Qtc of 0.707, I changed my mind and decided to put both drivers in one cabinet in a compound, face-to-face arrangement. I think that's how they were used in the Saturn. So would you recommend testing the face-to-face drivers horizontally, close to the floor, like I plan to use them?
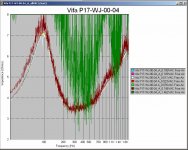
Also, I've played with test voltages with other drivers with lighter cones (Vifa P17WJ-00-04 and some tweeters) with the drivers only vertical, and seen no effect of test voltage over a very broad range. So I just made the assumption that the same would hold for this woofer. What you say about surround compliance makes sense, and I was, indeed, surprised when I did not find an effect of the driver I tested. I'll re-test my AC woofers with a variety of different voltages and post again!
After getting such helpful advice, I plan to post any new data before cutting any boards!
Thanks again,
-Byron
I have a question about your preferred measurement method. Everything I've read on measurement says to tightly constrain the driver during testing, including Vance Dickason's book. But you do the opposite. How do the results differ between hanging a driver from a chain vs. clamping to a test jig? And why do you prefer the hanging method?
Reflections from the floor are something I hadn't seriously considered. I have a test jig which can hold a driver far from reflected surfaces, but chose the method I did because I plan to have the driver similarly close to the floor in the subwoofer I plan to build. So I guess my results still would have applied to my specific application, but can not be generalized to this driver over a variety of applications. After seeing the box volume I would need to get a Qtc of 0.707, I changed my mind and decided to put both drivers in one cabinet in a compound, face-to-face arrangement. I think that's how they were used in the Saturn. So would you recommend testing the face-to-face drivers horizontally, close to the floor, like I plan to use them?
Also, I've played with test voltages with other drivers with lighter cones (Vifa P17WJ-00-04 and some tweeters) with the drivers only vertical, and seen no effect of test voltage over a very broad range. So I just made the assumption that the same would hold for this woofer. What you say about surround compliance makes sense, and I was, indeed, surprised when I did not find an effect of the driver I tested. I'll re-test my AC woofers with a variety of different voltages and post again!
After getting such helpful advice, I plan to post any new data before cutting any boards!
Thanks again,
-Byron
Last edited:
One other thing you might consider, the VC temp. I run ~20 min. of music through my drivers before testing so they warm up.
Suspension temperatures matter as well (rubber more-so than foam), if a driver is going to be used in a room that is 72deg.F test the driver at 72deg.F
I use a laser thermometer to check for consistancy.
If this is going to be in a car... all bets are off. good luck.
rev.
Suspension temperatures matter as well (rubber more-so than foam), if a driver is going to be used in a room that is 72deg.F test the driver at 72deg.F
I use a laser thermometer to check for consistancy.
If this is going to be in a car... all bets are off. good luck.
rev.
Well, I'm by no means an expert, but I think the main things to consider are whether you're affecting the airflow around the driver, and whether you're going to get spurious vibration problems from the way you're mounting the driver during testing.Thank you, Simon, for the comments. The learning curve is, indeed, steep!
I have a question about your preferred measurement method. Everything I've read on measurement says to tightly constrain the driver during testing, including Vance Dickason's book. But you do the opposite. How do the results differ between hanging a driver from a chain vs. clamping to a test jig? And why do you prefer the hanging method?
The ideal method would probably be to use a giant clamp around the magnet structure coming from well behind the driver using a long but very solid arm, such that other than this clamp there are no nearby objects (such as a bench top or floor) within at least half a metre of the cone. Good idea in theory but difficult to realise in practice unless you have a special test jig devoted to this sort of thing.
You can't clamp directly on the ceramic of the magnet as it's brittle and will crack, so you'd need a specially shaped clamp that clamps on the steel part of the magnet structure.
If you clamp the driver by the front baffle as you've done and is often recommended that's fine for securing the driver but now you have nearby objects in close proximity to the cone which will affect the measured results. (Fs will be different measured on a baffle than free air, and nearby objects around the cone like your bricks will give some intermediate result between the two, and after all, Fs is supposed to be "free air" resonance, eg with no nearby objects or baffles)
The reason for people saying the driver should be securely clamped is because if you had it poorly clamped the moving mass of the cone could cause the frame of the speaker to buzz and vibrate against the mounting, which would give spurious results.
This is different to hanging the driver from a cord in free space - in that case there's nothing for it to buzz against and it's the drivers own mass inertia that holds it in place.
When suspended the frame will move very slightly in the opposite direction to the cone in proportion to their relative masses, but given how inaccurate T/S measurements generally are (a few percent at best) I don't think it's much of a problem. On a 12" woofer where the cone moving mass is 50 grams and the rest of the speaker weighs nearly 5Kg, you have a 100/1 mass ratio.
Therefore a 1mm excursion of the cone when the frame is securely clamped would instead be a 0.99mm excursion with the frame moving 0.01mm in the opposite direction. This won't have any direct effect on the resonance of the driver though, as the motion of the cone is relative to the frame, so there is still 1mm of excursion.
The only thing I can see this might affect is the mass loading from the air. A small percentage of the moving mass is actually the air immediately on either side of the cone, which depends on the cone area - for a 12" driver it's about 5 grams.
So you might have a 50 gram cone + 5 grams of air load mass giving you an Mms of 55 grams. When you suspend the driver by a long cord the cone excursion relative to stationary air is slightly reduced by 1%, which means the added mass from air loading would be 4.95 grams instead of 5 grams, so total mass changes from 55g to 54.95g - an insignificant change.
On the other hand, apart from a cord you have no nearby objects or baffles to affect the airflow around the cone. Ideally you'd want the cord to be at least 0.5 - 1m long, for example hanging from the rafters in a garage. Although I never bothered with it, if you want to get the driver exactly vertical you could use a second parallel cord that has a loop that goes around the magnet.
Can't say I agree with this idea - the drivers T/S parameters are what they are, you don't measure them differently just because the driver is going to be used in an application where is near the floor - you allow for that in the design. Free air T/S measurements should still be taken in free air, not close to the floor.Reflections from the floor are something I hadn't seriously considered. I have a test jig which can hold a driver far from reflected surfaces, but chose the method I did because I plan to have the driver similarly close to the floor in the subwoofer I plan to build. So I guess my results still would have applied to my specific application, but can not be generalized to this driver over a variety of applications.
Besides, if the driver is vertical there will be little or no difference in it's in-cabinet response due to being close to the floor, because the loading of the box will dominate the response.
Yes the response at the listening position will change with the woofer closer to the floor, but that's because of different boundary cancellation / room mode effects, if you were to measure the near-field response of the woofer (microphone 0.5cm from the middle of the cone) with the finished speaker up in the air and close to the floor there would be almost no measurable difference.
The time when it does matter is if the driver is facing INTO the floor, for example a sub-woofer where the driver is facing down at the floor and there is only a couple of inches gap between the bottom of the box and the floor. In that case yes the floor will affect the tuning of the cabinet, but not in a way that you can derive from attempting to measure the T/S parameters with the woofer facing down into the floor.
Interesting...what software and test method are you using ?Also, I've played with test voltages with other drivers with lighter cones (Vifa P17WJ-00-04 and some tweeters) with the drivers only vertical, and seen no effect of test voltage over a very broad range. So I just made the assumption that the same would hold for this woofer. What you say about surround compliance makes sense, and I was, indeed, surprised when I did not find an effect of the driver I tested. I'll re-test my AC woofers with a variety of different voltages and post again!
Last edited:
I re-read Vance Dickason's chapter on testing and he is consistent with you, saying you will get slightly more accurate results by clamping to a test jig. He also recommends as a test jig suspending the driver between boards facing up, just for convenience.When suspended the frame will move very slightly in the opposite direction to the cone in proportion to their relative masses, but given how inaccurate T/S measurements generally are (a few percent at best) I don't think it's much of a problem.
However, he writes "As the drive level increases, especially when measuring small diameter drivers, the resonance frequency also moves upward. The measurements being made are for use the small-signal mathematical models, so the measurement voltage should be "small"." This is the opposite of what you found, right? Your Fs moved down until you started approaching Xmax.
I'm using SpeakerWorkshop by Audata with a Wallin Jig. At the time I was using a Rocketfish sound card and an Insignia receiver. For this subwoofer test I used the Behringer UCA222 instead of the sound card, and my LM3886 amp instead of the receiver. Enclosed are the graphs showing overlapping impedance curves from 0.011VAC to 0.339VAC. I think above 0.339VAC the soundcard started to clip.Interesting...what software and test method are you using ?
Attachments
Just a couple of quick comments. Signal magnitude and even the type of signal (Sine vs. MLS, etc.) may yield slightly different results. Indeed, boundary effects may also impact the results. I did several experiments comparing different methods including a clamp holding the magnet structure (it was a non metallic clamp) as well as the suspension technique and the sit the driver on the ground technique. The warm up period was held constant by timing of the warm up signal and cool down period. I no longer have the data but I can tell you when the enclosure size was calculated, there was less than a 3% variance in size. This variance becomes somewhat inconsequential once you start looking at carpentry dimensions (they always vary slightly from plan), stuffing, wall bracing, and other wall materials that you might opt to use to absorb sound energy inside the box. Just my two cents,
Jay
Jay
I've never done a direct comparison between suspending the driver or clamping it, mainly because I haven't had the facilities needed to solidly clamp a large driver yet keep it well away from other objects. On the other hand it's easy to hang a strong rope/cable/chain or two over a beam to suspend it in mid air, so that's the way I've usually done it.I re-read Vance Dickason's chapter on testing and he is consistent with you, saying you will get slightly more accurate results by clamping to a test jig. He also recommends as a test jig suspending the driver between boards facing up, just for convenience.
Yes, that's opposite to what I've found, which is a bit perplexing. I don't often have a chance to measure T/S parameters of drivers (it's not something you do every day when you have a fixed number of drivers you've already measuredHowever, he writes "As the drive level increases, especially when measuring small diameter drivers, the resonance frequency also moves upward. The measurements being made are for use the small-signal mathematical models, so the measurement voltage should be "small"." This is the opposite of what you found, right? Your Fs moved down until you started approaching Xmax.
) but next time I do I'll try a few other drivers.In the case of the 12" woofer it was a Visaton W300S, at very low drive Fs was 29.5Hz, as the drive level increased it stayed constant up to a point, and then started to drop with increasing drive, reaching 24Hz at 1/2 Xmax. (Which you can see plotted in the graph in the other thread I linked to)
Interestingly Visaton's claimed Fs is 22Hz, so the smallest drive level was actually furtherest away from the claimed figure, with the largest drive level being closer. I have to wonder if the manufacturer is measuring it at a relatively high drive level, on an infinite baffle, or whether there is just a large tolerance in T/S parameters in production - although both drivers I have measure nearly identically.
Fs is dictated by effective moving mass and suspension compliance - mass can't be changing with drive level so it can only be changes in compliance at work here.
Another interesting fact I dug up on wikipedia and posted in that other thread is that any mass/compliance resonant system (such as a weight suspended by a spring) only has a single resonant frequency if the spring is perfectly linear. As soon as a spring has some form of non-linearity, (in force vs displacement) the resonant frequency becomes dependent on amplitude. Since suspensions on drivers are very non-linear compared to a coil spring it's not a big surprise that the resonant frequency is then dependent on excursion.
I have to agree with this - T/S modelling software does tend to give the impression that there is greater accuracy there than what there really is - lots of decimal places on the T/S parameters, very accurate graphs etc, but really it's only an approximation good to a few percent at most because (a) it's difficult to measure T/S parameters extremely accurately, especially with the delta mass method, which isn't very accurate, (b) T/S parameters of drivers do fluctuate - Re changes with temperature, Cms changes with temperature, excursion, can have weird memory effects, can change as the driver ages etc (c) production tolerance of drivers particularly Cms can be quite poor, even on expensive drivers.I no longer have the data but I can tell you when the enclosure size was calculated, there was less than a 3% variance in size. This variance becomes somewhat inconsequential once you start looking at carpentry dimensions (they always vary slightly from plan), stuffing, wall bracing, and other wall materials that you might opt to use to absorb sound energy inside the box. Just my two cents,
Jay
It's quite common for Fs, Qms and Vas to all be a long way from the manufacturers claimed figures due to production line variations of Cms and the general instability of Cms as a mechanical parameter.
In most alignments it doesn't really matter though, because depending on the tuning ratio the box has a far greater effect on the response than the compliance of the suspension - and this applies to bass reflex as well as closed.
Some alignments are more sensitive to variations in Cms than others though, and I would consider an alignment where small variations of Cms have a large effect on the response - such as the onset of peaking in the response, to be a poor choice of alignments, and I would rather go with "safer" alignments which are "less sensitive" to variations in Cms. (This usually means tuning slightly in the overdamped direction so that you'll still get an acceptable response within the range of expected T/S tolerances)
Hey Thats really a good work, and lot of new good information too. Just thinking, if the positioning of drivers can slightly change its parameters. then should we measure drivers in the position which they would be mounted ? this is just a thought that flashed my brain.
Secondly, the method used was added mass method. Does the same variations exists when we use known box method ?
Secondly, the method used was added mass method. Does the same variations exists when we use known box method ?
It has been suggested to measure T/S parameters in the position that the driver will ultimately be mounted. I stress, however, that T/S parameters will change based upon several things, the voltage applied to the signal as well as the type of signal applied (Sine, MLS, etc.), nearby reflections, the mode of testing (added mass vs. closed box method), and even how long you warm up the speaker and loosen the suspension. In the end, T/S parameters give you an approximation for your enclosure design. You will find that it will not be exact but will get you in the ballpark and you can fine tune the enclosure tuning after the build by either decreasing the length of the port (if ported) and/or by decreasing the enclosure size (adding additional bracing) or inserts of wood. You may be able to effectively increase the apparent enclosure size slightly by adding stuffing but this will be limited; in the end, it is best to use T/S parameters to get an approximate enclosure size, design the enclosure to have that amount of internal space plus the space needed for the driver, the port, bracing, and then a buffer. Like I said, it easier to build large and decrease the space than to build small and increase it. You can more easily tune up the frequency (by making the enclosure smaller or by shortening the port) than tune it down.
Jay
Jay
Also, as DB Mandrake pointed out, it is likely that my experiment was flawed by having the drivers too close to the floor. Thus, all of the results may be completely invalid!
I'm in the process of repeating the experiment mounting the drivers on a home-made jig. I'm also going to try DB Mandrake's idea of hanging the drivers from the ceiling. Unfortunately, this will take a while because my jig takes a while to set up and mount driver to. And then I have this job which sucks up so much of my time.
Expect more data Saturday afternoon/evening (Central standard time)
-Byron
Good thinking to have a go at this. Looking at the specific parameters and whether they have increased or decreased in relation to other parameters, I think the issue is more to do with tolerances on the individual drivers. Also if you look at the combined result of Fs, Qts and Vas you will see that the changes go a long way to cancelling each other out.
I think that the coil and the cone have some weight that changes position of the coil in magnetic gap, also it is reflected on suspension's properties.
Also, suspension itself has asymmetric properties.
Thank you everyone who responded with your suggestions. I'm finished with my second round of experiments and have posted them in another thread in this forum, called "Subwoofer testing orientation: Part II". Unfortunately, Fs, Vas, and Qts did not cancel each other out. So I'm still stuck not knowing what parameters to use.
-Byron
-Byron
Since it's really just a continuation of this thread it might have been better to just post your updated findings here. There's so many threads on this forum that zoom by so quickly that I find it hard to find any thread that I'm not subscribed to....except those that happen to be top of the list when I log in...
Perhaps posting a link to the other thread would be a good idea so other readers following this thread can quickly find it.
Edit: PS, interesting results, my first impression is that there is still something going a bit wrong with the measurement procedure (maybe the audio interface or software setup) but it's late so I'll post a proper reply tomorrow when I've had time to read and digest it...
Last edited:
I've not inserted a link before. I hope this works.
http://www.diyaudio.com/forums/subw...-testing-orientation-part-ii.html#post2603345
I'll try this too http://www.diyaudio.com/forums/subw...-testing-orientation-part-ii.html#post2603345
http://www.diyaudio.com/forums/subw...-testing-orientation-part-ii.html#post2603345
I'll try this too http://www.diyaudio.com/forums/subw...-testing-orientation-part-ii.html#post2603345
- Status
- This old topic is closed. If you want to reopen this topic, contact a moderator using the "Report Post" button.
- Home
- Loudspeakers
- Subwoofers
- Interesting finding: Driver orientation effects T/S parameters.