the le value rizez as freq drops,for subs you can easely double le value.
Epa
Well now, that is interesting ...
The LE figure on hornresponse is based on a 1khz standard right? Same with woofer inductor values as well as crossover inductor values, correct?
However strange it may be i suppose the system works if we stick to the same standards.....
I have to wonder if hornresponse takes this phenomenon into account and actually runs it's internal calculations using double the inductance figure listed in the LE field, in the bass range ...
If not i suppose it would explain why the peaks and saddles of a tapped horn can sometimes be moreso exaggerated in the hornresponse simulations as opposed to real world measurements ... If this is the case then perhaps we could always just increase the LE figure a bit in simulation to get a better idea of what the real world response will actually be like ..... Just a thought .....
If Mr McBean is around maybe he can enlighten us on this inductance issue ....
And I'm wondering how the heck you can get a 4" VC driver to have such a low BL.....
Wg_Ski thats very observant !
 I took a second glance at the specs for this 15W1600 driver today and saw the 13.5 BL rating and it simply doesn't compute......More than just suspicious , the numbers simply don't work
  ..... The VAS listed on PE is also very different from what is stated on the PDF file ....
I have contacted PE and asked them to put a WT3 on this driver to see what they get ...
When i first tried to sim this driver i had assumed it had a BL factor of around 20 which is what you would need to get the QTS they have listed with a VAS of 63Liters and MMS of 105... If the specs turn out to be remotely close to the ones i used in my sim then it actually works incredibly well in a small single sheet sized straight tapered 40hz TH, great extension without sacrificing too much sensitivity , it could end up being an off-brand pleasant surprise!
 ...I will post my inputs if the specs i used turn out to be truly correct .... Who knows what the specs will really be though, PE will get back to me soon enough im sure ..
Last edited:
I have to wonder if hornresponse takes this phenomenon into account and actually runs it's internal calculations using double the inductance figure listed in the LE field, in the bass range ...
Hi Matthew,
Hornresp assumes a constant inductance Le at all frequencies. The reactance of the inductance increases with frequency.
Kind regards,
David
Awesome! Thank you David and Epa 
That clears some things up for me ... I will remember to always bump up the LE for subwoofer sims to get more realistic graphs
I absolutely LOVE your software David! Hornresponse is not only helpful but has become essential to me! I cannot imagine just how dreadful horn designing must have been back in the dark ages before you crafted your masterpiece
Awesome! Thank you David and Epa
That clears some things up for me ... I will remember to always bump up the LE for subwoofer sims to get more realistic graphs
I absolutely LOVE your software David! Hornresponse is not only helpful but has become essential to me! I cannot imagine just how dreadful horn designing must have been back in the dark ages before you crafted your masterpiece
That leads me to think
how manufacturers made and design their subs
10 yrs or 20 yrs before this tools
Hi all,
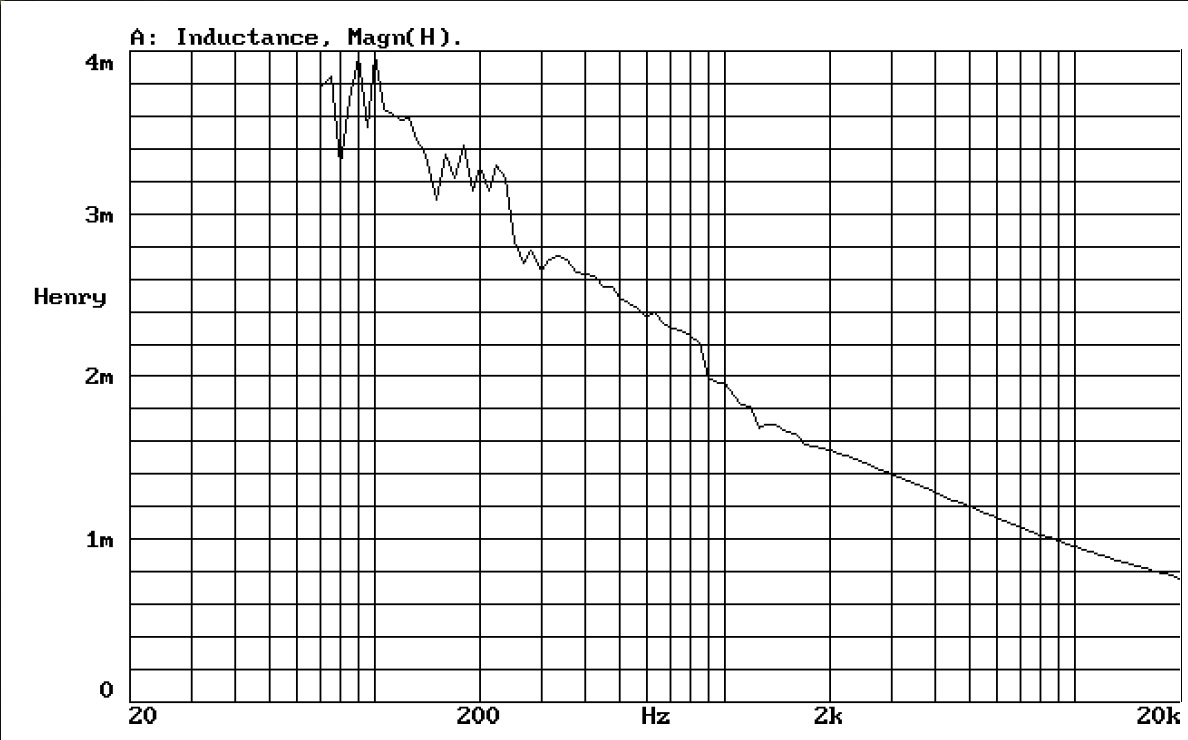
The inductance plot shown in post#1863 is probably of a driver in a closed box. Therefore the plot shows a relative stable character that rises from 1Khz going down. In Tapped Horns the inductance is much more complex.
I think what David McBean was trying to communicate is that inductance is a complex interaction between lots of parameters; an electric component (impedance), an acoustic component (air load) and mechanical components (moving mass and its mechanical resistance). What makes it even more complex is that some of these components are also time/frequency related (phase). The relation between all these parameters is called the 'impedance phase angle' to which the inductance responds (inductance reactance). HornResp calculates perfectly the inductance for every frequency.
When one changes the Le value it changes the 'impedance phase angle' over the entire response! That often leads to wrong plots/assumptions. Therefore increasing the Le value to compensate 'something' is only valid if 'something' is well understood. Maybe even more important, if the limitations of such compensation is understood.
Awesome! Thank you David and Epa
That clears some things up for me ... I will remember to always bump up the LE for subwoofer sims to get more realistic graphs
I absolutely LOVE your software David! Hornresponse is not only helpful but has become essential to me! I cannot imagine just how dreadful horn designing must have been back in the dark ages before you crafted your masterpiece
Hi Matthew,
Thanks for your kind words - they are much appreciated
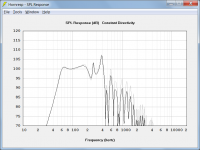
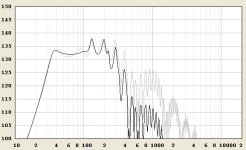
.I am a bit surprised that doubling the value of Le would make a worthwhile difference to the predicted response across the desired subwoofer passband. For example, in the attached screenprint the gray trace shows a typical tapped horn with a driver voice coil inductance Le of 1.2 millihenrys, and the black trace shows the same horn with 2 x Le.
With this example, it is only above about 400 hertz that the difference in response becomes meaningful.
Kind regards,
David
Attachments
HornResp calculates perfectly the inductance for every frequency.
Hi Djim,
Just to clarify - Hornresp calculates the reactive impedance (or reactance) of the inductance at each frequency. The value of the inductance itself (Le) does not change with frequency.
Kind regards,
David
David ,
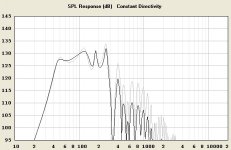
The link i pasted in this message was an example i found of what seems to often happen when people compare their simulated graphs with their measured responses ... I know it doesn't always work out exactly this way but it does seem to frequently show this pattern as far as i can tell ...
In this example the Sim shows a slight dip, like a "saddle" between two peaks..Im talking about the first peak at just under 30hz and the other just above 70hz with the dip being centered around 40hz ..... However in the measured response the dip is diminished and the peak at around 30 is gone completely .... The results are moreso flat than the model ... People will say that this is due to various "losses" and maybe this is true but i have also noticed that i can create the same effect in simulation by simply increasing Hornresponse's LE/inductance value ..... It may be purely coincidental but it seems to work ... Sorry to "preach to the choir" because i know many people have already noticed this pattern ...
A similar thing also seems to sometimes happen when a TH simulation has a perfectly flat graph in HR but once built and measured it shows a real-world rise somewhere in the middle (maybe around 50-70 hz depending on where the TH is tuned) and a slight sagging on the lower end of the usable response falling short by a few decibels compared to the sim around the fundamental ..... This is also a scenario that can be emulated by added some LE in the simulation ...
I know it may be improper to add LE to sims but in some cases it does seem to help get you closer-ish to real world results.
http://lh3.ggpht.com/_WXjTASetbPo/S6--SUoO7kI/AAAAAAAAATo/ElI3P445PX4/anarchy 1w1m.JPG
Last edited:
hi davidHi Matthew,
Thanks for your kind words - they are much appreciated
I am a bit surprised that doubling the value of Le would make a worthwhile difference to the predicted response across the desired subwoofer passband. For example, in the attached screenprint the gray trace shows a typical tapped horn with a driver voice coil inductance Le of 1.2 millihenrys, and the black trace shows the same horn with 2 x Le.
With this example, it is only above about 400 hertz that the difference in response becomes meaningful.
Kind regards,
David
the black trace looks a bit flatter.
al the th i have seen so far al have a flatter responce in realety then the sim ,under 100hz.
when you double le value in that sim ,its much closer to the real thing.
i know pannelflex could play a part also.
id like to see some th comparisons between 1 watt and 100 watts,to see if amplitude plays a role here to.
FWIW, this example indicates an improper tap point WRT driver specs to me.
GM
Hi DAvid,Just to clarify - Hornresp calculates the reactive impedance (or reactance) of the inductance at each frequency.
Sorry, time was up to change my post. Correct me if I am wrong but as far I know is the electrical resistance of an inductor in an AC circuit called an 'inductive reactance' and in a DC circuit a 'reactance'.
Correct me if I am wrong but as far I know is the electrical resistance of an inductor in an AC circuit called an 'inductive reactance' and in a DC circuit a 'reactance'.
Hi Djim,
The electrical reactance (not resistance) of an inductor in an AC circuit is called an 'inductive reactance' or reactive impedance.
The electrical resistance of an inductor in a DC circuit (or in an AC circuit) is called a resistance or resistive impedance (not 'reactance').
Reactance is a measure of the opposition of an inductor to a change in electrical current. The magnetic field generated in the inductor coil by the changing current acts to resist the change. Reactance does not apply in a DC circuit.
The impedance of an inductor coil at frequency f hertz is given by:
Z = R + j * X
where:
Z = complex impedance in electrical ohms
R = resistance in electrical ohms
j = imaginary operator sqrt(-1)
X = reactance in electrical ohms
and:
X = w * L
where:
w = 2 * pi * f in radians
L = coil inductance in henrys
R is the resistive or real component of the inductor’s complex impedance, and w * L is the reactive or imaginary component.
In Hornresp, R = Re and L = Le.
Kind regards,
David
FWIW, this example indicates an improper tap point WRT driver specs to me.
GM
Hello GM ,
I suppose yes, That is possibility .... Its a sim/measure graph comparison for a small TH based on the the miniature Anarchy sub driver ..... I didnt make it, it was someone else's project ........
when you double le value in that sim ,its much closer to the real thing.
i know pannelflex could play a part also.
id like to see some th comparisons between 1 watt and 100 watts,to see if amplitude plays a role here to.
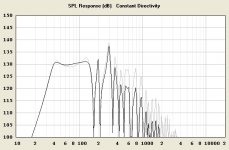
For Epa , and David and folks who are following,
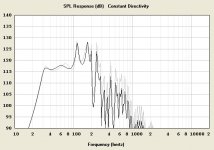
I have thrown together a few of my own simulated examples of smoothing due to increased LE ..... Some examples use 2x LE , and some use more like 3x or 4x the driver's LE ....
Its a few compact compact TH cabinets (ss15 with 15tbx100 and small TH with dual 8" mcm 55-2421s) , and also for fun i included a tapped pipe (transflex) type design ...... The smoother response in these examples is accomplished with the raised LE in the simulation but if built and measured the real world results can often be just as smooth with less series inductance added, or in some cases none at all when the "saddle" dip and peaks in hornresponse are mild to begin with.....
I assume some of the more extreme cases of ripple and dips would still require some amount of added LE to smooth them out just as Mr Danley does with some of his boxes by adding inductors in series with some of his drivers..
Attachments
- Home
- Loudspeakers
- Subwoofers
- Single sheet TH challenge