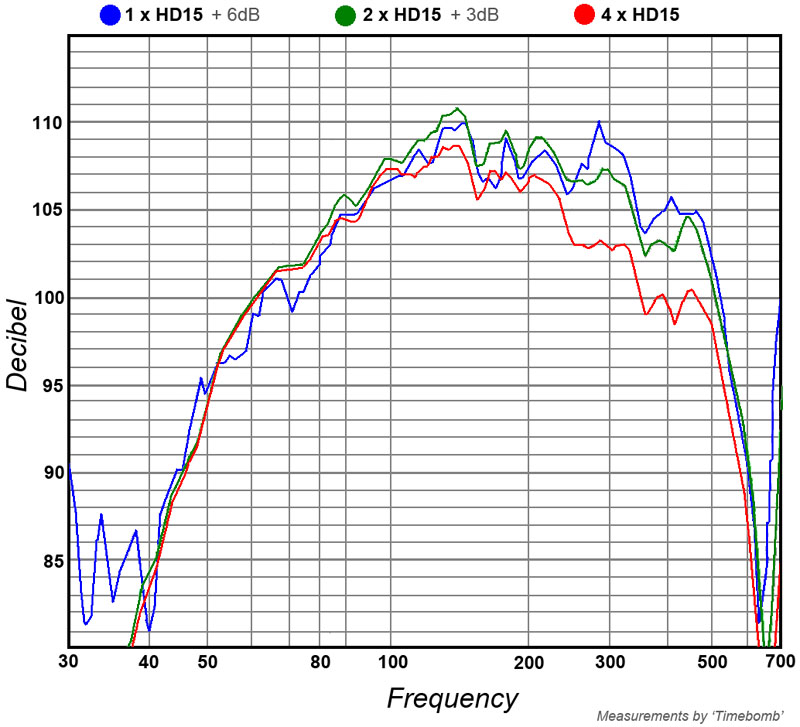
I have also finished the measurements of the HD15's. To prevent confusion these measurements are based on Watt constant instead of Voltage constant. Therefore the steps are +3dB for dual setting and +6dB for single setting.
Hi Djim,
Not sure if I understand how to interpret the measurements correctly.
Just to clarify, are these results saying that for constant input power:
With 2 speakers connected in parallel compared to a single speaker, the gain at low frequencies is +3 dB and the gain at high frequencies is approximately +1.5 dB?
With 4 speakers connected in parallel compared to a single speaker, the gain at low frequencies is +6 dB and the gain at high frequencies is approximately +3 dB?
If so, does this then mean for constant input voltage:
With 2 speakers connected in parallel compared to a single speaker, the gain at low frequencies is +6 dB and the gain at high frequencies is approximately +3 dB?
With 4 speakers connected in parallel compared to a single speaker, the gain at low frequencies is +12 dB and the gain at high frequencies is approximately +6 dB?
If so, then the measured results would appear to be consistent with the predictions of the existing Hornresp multiple speakers model.
Kind regards,
David
Djm's plots seem to show good correlation for the +3dB for each doubling of driver @ the same power input over the frequency range 42Hz to 130Hz.
Above 130Hz the gain is clearly less than +3dB as the two comparisons show.
The dual driver shows fair good correlation to beyond 250Hz, then I'm not sure how to interpret what is shown.
The quad driver is clearly showing less than +3dBbeyond 130Hz and gets worse as the frequency moves towards 450Hz. Then I can't extract a sensible trend due to the rapid roll-offs.
This supports my original contention that the +3dB efficiency gain is only available over a restricted frequency range.
If one used full range driver/s and repeated DJM's experiment, I think that restricted frequency range to stand out even more clearly.
i.e. we need to see performance upto >3kHz to SEE clearly the missing 3dB efficiency gain. The beaming of a group of HF drivers will be so severe that they become un "hifi" at high frequency.
If you use the 'end correction' of 1/4WL acoustics as tool for calculating the drop, the results look similar to what these people have measured. I don’t know what theory/formula HornResp is using now, but it looks like there is something wrong as mentioned by Art from the beginning.
When using the 1/4 WL method, what frequency is the quarter WL determined from?
On end correction: many of you may know this, but the term refers to the effect of the radiation impedance at the end of a tube, that changes the effective length of the tube. When calculating the fundamental resonance frequencies of a tube, one usually assumes a zero impeance in the open end. This will give a slightly higher resonance frequency than if the actual radiation impedance was used, so instead one uses the acoustical length of the tube, which is the physical length + the end correction.
At low frequencies, the radiation impedance is mainly a positive reactance, a mass. A model often used for a flanged tube, is the radiation impedance of a rigid piston in an infinite wall. At long wavelengths (circumference of the tube typically smaller than half a wavelength), the acoustic mass can be calculated as
Mar = 8/3pi * a * rho
This mass has the same effect on the resonances of the tube as lengthening the tube by 8/3pi * a, this is the end correction. a is the radius of the tube.
For an unflanged tube, the factor 8/3pi (0.85) is replaced by 0.61.
This is of course a low frequency approximation, and the actual expression for the radiation impedance should be used to get good accuray over a larger frequency range. Especially for horns. This is what Hornresp does. Note also that the end correction is used for calculating resonance frequencies, not for calculating radiated power etc.
Note that there is no relation to the wavelenght, other than it should be large compared to the tube radius. Only the size of the tube is important.
Regards,
Bjørn
On a similar but unrelated note, I think most people know that bass-reflex speakers don't generate much output below the Helmholtz frequency because the pressure from the port cancels the pressure from the front of the cone. I don't think anyone would expect to gain much under-resonance output by boundary loading or grouping reflex boxes. In the passband, sure, but not below the passband.
But I think some may not realize that the Helmholtz frequency is modified by the boundary conditions of the port. There is a length adjustment made based on the area of the port. The proximity to boundaries has an effect on the Helmholtz frequency too. This is an interesting similarity to pipe-mode length correction.
Another side note: Internal standing waves can make a vented cabinet exhibit both Helmholtz resonance and pipe-mode resonance. For relatively small subwoofer cabinets, this isn't usually an issue, as standing waves only occur above the passband. But full-range (mains) speakers and large subs often have a standing wave mode fall within the passband. One should be careful not to use a port long enough that it has standing wave modes in the passband. But large cabinets develop standing wave modes inside them too, much like room modes, but in the midbass to midrange band. That's an annoying problem, since acoustic insulation is not very effective at those frequencies.
I have found that careful choice of port position is important, to make sure the port isn't in a pressure node. I also almost always install a sheet of insulation spanning the cross-section of the cabinet, to further attenuate these higher-frequency standing waves. These things really help mitigate response ripple.
Sorry for going slightly off-topic. Seemed sort of related to mention port length correction in Helmholtz resonators. And that got me off on a tangent about internal standing waves.
As you correctly show 1 to 16 coherent summation is 24 dB, incoherent summation +12, 1-15 incoherent summation +11.77.Hi Art,
Just to clarify - how did you arrive at +15 dB for 16 speakers connected in parallel?
Coherent summation:
1 to 16 = +24 dB
Incoherent summation:
1 to 16 = +12 dB
Are you perhaps assuming that the test signals being summed in this case would be partially coherent only?
Using the original Hornresp model for 15 speakers in parallel, the difference is predicted to be +23.60 dB at low frequencies and +11.77 dB at high frequencies. Interestingly, this is consistent with the speaker outputs being coherent at low frequencies, but becoming progressively less coherent at higher frequencies due to directivity interference effects.
Kind regards,
David
I made a math error and added +6 instead of +3 in one of the doublings and came out with +15 instead of +12, doh.
The +12 dB (or 13 as you read it) difference in the 1986 Leap version 2.10 simulation for 1 to 15 (why 15?) cabinets is within a dB or so of an incoherent summation across the entire frequency range. You would have a better guess as to what goes on “under the hood” with Leap than I.
Incoherent summation across the entire frequency range in small rooms does seems to be the case as independently measured by several DIY folks using dB meters, considering the size of the cabinets perhaps the Leap simulation is figured for small rooms rather than 1/2 space.
Since you have shown interest in the 1-8 multiple BR and sealed cabinet tests, I will do them today.
I'll be posting the results in a new thread, as this discussion is off topic regarding the single sheet challenge.
Art
Hi Art,
Post #1365: "...Since you have shown interest in the 1-8 multiple BR and sealed cabinet tests, I will do them today.
I'll be posting the results in a new thread, as this discussion is off topic regarding the single sheet challenge...."
This would be great. Maybe a moderator can move the whole discussion into its own thread?
Regards,

Good article about sum here http://www.aes.org/tmpFiles/elib/20120113/6041.pdf
can't find "Complete Analysis of Single and Multiple Loudspeaker Enclosures" from Chris N. Strahm. Is someone can upload it?
can't find "Complete Analysis of Single and Multiple Loudspeaker Enclosures" from Chris N. Strahm. Is someone can upload it?
Test results are in a new thread:Hi Art,
Post #1365: "...Since you have shown interest in the 1-8 multiple BR and sealed cabinet tests, I will do them today.
I'll be posting the results in a new thread, as this discussion is off topic regarding the single sheet challenge...."
This would be great. Maybe a moderator can move the whole discussion into its own thread?
Regards,
http://www.diyaudio.com/forums/subwoofers/204472-multiple-cabinet-combined-response.html
Art
Hi Djim,
Not sure if I understand how to interpret the measurements correctly.
Hi Djim,
After catching up on a bit of sleep, I think I have managed to answer my own questions
.Please disregard the comments I made - some of the gains I assumed, were incorrect.
Attached for comparison purposes are a copy of your latest test results, together with the equivalent results predicted by Hornresp using the existing multiple speakers model.
The blue trace was generated by considering a single speaker with Pmax = 4W and Xmax = 99. This means that the total constant input power to the array is 1 x 4W = 4W and that the results are not displacement limited at any frequency. A fixed 6 dB was then manually added to normalise the results, similar to yours.
The green trace was generated by considering two speakers in parallel with Pmax = 2W and Xmax = 99. This means that the total constant input power to the array is 2 x 2W = 4W and that the results are not displacement limited at any frequency. A fixed 3 dB was then manually added to normalise the results, similar to yours.
The red trace was generated by considering four speakers in parallel with Pmax = 1W and Xmax = 99. This means that the total constant input power to the array is 4 x 1W = 4W and that the results are not displacement limited at any frequency.
The speaker used in the Hornresp simulations is not the HD15.
Kind regards,
David
Attachments
Last edited:
Chaps, if you give me a list of relevant posts and an appropriate title, I'll move them all over into a new thread. Fascinating discussion BTW, I'll be subscribing.
Although I would encourage continued response regarding multiple cabinet response in the new thread here:
http://www.diyaudio.com/forums/subwoofers/204472-multiple-cabinet-combined-response.html
my preference would be leaving this thread as is, many of the posts refer to specific points by thread post number, once that context is broken it will be hard to follow if various posts are imported.
Art Welter
(why 15?)
Hi Art,
Fifteen rather than sixteen speakers were used because "during the outdoor measurements one speaker was immediately burned out in an effort to raise the SPL level above the background noise."
The speakers used in the tests were quite small.
Kind regards,
David
Test results are in a new thread:
Many thanks Art.
Kind regards,
David
The post can be copied out and/or transfered out.my preference would be leaving this thread as is, many of the posts refer to specific points by thread post number, once that context is broken it will be hard to follow if various posts are imported.
Art Welter
If post references are a concern then simply copy out the relevant posts.
Good article about sum here http://www.aes.org/tmpFiles/elib/20120113/6041.pdf
Pretty good article. It mentions the effect proximity to boundaries has on the Helmholtz frequency, as I said in post 1364. It was slighly off-topic, being about bass-reflex speakers, but it is interesting, nonetheless. It shows that the "length correction" phenomenon isn't limited to horns and transmission lines.
Hi David,Hi Djim,
Not sure if I understand how to interpret the measurements correctly.
Just to clarify, are these results saying that for constant input power:
With 2 speakers connected in parallel compared to a single speaker, the gain at low frequencies is +3 dB and the gain at high frequencies is approximately +1.5 dB?
With 4 speakers connected in parallel compared to a single speaker, the gain at low frequencies is +6 dB and the gain at high frequencies is approximately +3 dB?
If so, does this then mean for constant input voltage:
With 2 speakers connected in parallel compared to a single speaker, the gain at low frequencies is +6 dB and the gain at high frequencies is approximately +3 dB?
With 4 speakers connected in parallel compared to a single speaker, the gain at low frequencies is +12 dB and the gain at high frequencies is approximately +6 dB?
If so, then the measured results would appear to be consistent with the predictions of the existing Hornresp multiple speakers model.
Kind regards,
David
Indeed, Voltage constant gives steps of 6dB and Power constant should give 3dB, for each doubling. In my view the problem is not the counting or even the reading from the plots, it’s about finding the right acoustic theory. As long nobody finds the responsible mechanism for the change in coupling higher up, I would think twice to change anything in HornResp. With all respect to everybody’s measurements, in my view these plots should only be used for indication and/or conformation and should not be used as assumptions for ‘fine tuning’ the ideal model of HornResp.
However, maybe a simple ‘sensitivity' button for 1W/1m response, based on the lowest impedance within the bandpass, would be very helpful.
Thanks for HornResp as I find it a very inspiring tool!
Last edited:
However, maybe a simple ‘sensitivity' button for 1W/1m response, based on the lowest impedance within the bandpass, would be very helpful.
Hi Djim,
Could the required sensitivity information be obtained as follows, perhaps?
1. Use the Maximum SPL tool with Pmax = 1 and Xmax = 99 to generate the 1W/1m response.
2. Check the electrical impedance curve to find the lowest impedance within the passband.
3. Sample the 1W/1m response at the frequency of that lowest impedance, to find the sensitivity.
Or did you maybe have something else in mind, when referring to sensitivity?
Kind regards,
David
Hi David,
I'll try to explain myself. The problem is not that I can’t find the sensitivity figure. When people compare they normally use 2,83V/m which doesn’t represent their sensitivity figures. In other words they are comparing their drivers instead of the true performance of their designs. For myself the biggest problem is, I like to design based on sensitivity figures instead of Voltage. It is very time consuming since I have to recalculate every time I change a driver. Besides that, I prefer exact numbers. When I use the electrical impedance chart in HornResp it seems to use some sort of steps, when I manually search for its lowest point. I do agree you can find a near to lowest impedance point but it doesn't seem to be exact.
That’s why I would like to see a 1W/1m capability. For example, a choice between Eg or Sf (Sensitivity figure 1W/1m) in the 'Input Parameters' screen would make it very user friendly. The Sf should use the exact figure on the lowest impedance of the bandpass of the model.
Another idea is to improve the functionality of the 'Impulse Response' by making the impulses, frequencies variable. Although you can see more frequency detail in the 'Spectrogram' it still doesn’t show as much information you can get from an Impulse per frequency plot (Pitch Shift function).
Hopefully this explains my suggestions.
Last edited:
Hi Djim,
The sampling frequency resolution and hence the calculation of impedance at a particular frequency, is limited by the width of the chart in screen pixels.
How is "bandpass" defined, and how is it determined? The exact figure for the lowest impedance is unlikely to be available - in Hornresp it would require the frequency to be at the exact position of a pixel.
The method used to calculate and display impulse response in Hornresp was developed by Jean-Michel Le Cléac'h. You would need convince Jean-Michel that any change was worthwhile.
Personally, I quite like the Impulse Response tool the way that it currently is. The less user-adjustable variables the better, as far as I am concerned.
Kind regards,
David
When I use the electrical impedance chart in HornResp it seems to use some sort of steps, when I manually search for its lowest point. I do agree you can find a near to lowest impedance point but it doesn't seem to be exact.
The sampling frequency resolution and hence the calculation of impedance at a particular frequency, is limited by the width of the chart in screen pixels.
The Sf should use the exact figure on the lowest impedance of the bandpass of the model.
How is "bandpass" defined, and how is it determined? The exact figure for the lowest impedance is unlikely to be available - in Hornresp it would require the frequency to be at the exact position of a pixel.
Another idea is to improve the functionality of the 'Impulse Response' by making the impulses, frequencies variable.
The method used to calculate and display impulse response in Hornresp was developed by Jean-Michel Le Cléac'h. You would need convince Jean-Michel that any change was worthwhile
.Personally, I quite like the Impulse Response tool the way that it currently is. The less user-adjustable variables the better, as far as I am concerned
.Kind regards,
David
Hi David,
Since they are ¼ WL systems the 'bandpass' is between 1/4WL and full wavelength I would think. If the lowest impedance is coupled to the graphic resolution instead of exact values, it is still better than having no option for sensitivity figures
Does that mean you are considering such function?
Since they are ¼ WL systems the 'bandpass' is between 1/4WL and full wavelength I would think. If the lowest impedance is coupled to the graphic resolution instead of exact values, it is still better than having no option for sensitivity figures
Does that mean you are considering such function?
- Home
- Loudspeakers
- Subwoofers
- Single sheet TH challenge