Karlson K15... Definately tapped and "keystoned?", but horn???
Karlson himself often claimed it was mathematically equivalent.
And Klipsh would flip his BS tie every time that was said...
...and Klipsh was correct, IMO
") .
.Using multiple stagger tuned resonant chambers rather than a
much longer and voluminous expanding path, its never been
modeled correctly that I know of.
I'll bet that it can be modelled with Akabak. The topology looks similar to an idea I came up with for modifying a TH to remove the first notch in the output. Search for "Subwoofer Dogfood Duct" to see what I'm talking about. However, modelling it is one thing - coming up with an optimized alignment is another.
I'll bet that the shape of the exit has little to do with the overall FR in the effective passband (i.e. before massive cancellations and peaks show up in the output), and it can be replaced with an equivalent circular cutout.
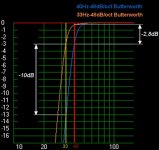
it looks like you have cascaded a pair of 4pole Butterworth filters to end up with a 6dB cut at the 40Hz and 33Hz.graphic representation of 2 Butterworth 48dB per Octave - lowcut filters. One is set to 40Hz (for standard SS15) and the other at 33Hz (Extended SS15)
These are no longer Butterworth, which by definition must be -3dB @ the turn over frequency.
Post #720
Hi Djim,
In the .pdf in Post #718 I tried to make the difference clear. On the left is an overlay drawing of the handdrawing you presented in Post #691. On the right is a drawing of what I assume a SS15-type TH would look like using your provided Hornresp input dimensions (obviously give or take a little). The layout on top is for the drawing on the right (I call it actual).
The one on the left cannot be build, you could build a layout like that, but you would have to use different Hornresp input values - or you could try to match the layout to the Hornresp values, which means you get a different layout (about the one on the right if you use the SS15-style). You just cannot have it both ways.
I have rechecked the drawing and values, and they still look correct. You are asking: "...what am I doing wrong here?...". I would suggest updating your tools. You would find even a rudimentary 2D drafting package to be a lot more accurate than your current method. It just forces you into putting real numbers with the items you draw, and if it has dimensioning capability you can extract just about any angle, line length, area you want to. You can turn layers on and off, that way you only see what you just want to look at.
If you are looking for a low cost version "Solid Edge 2D" is available free from Siemens PLM Software. There is nothing rudimentary about that package its quite nice. I know the learning curve may appear somewhat daunting, but luckily we forget about that after just a little while.
In addition to that you need to use a spreadsheet to verify your calculations, e.g.: duct cross-section v. width w. duct height.
So, I don't think you are doing anything wrong, I think your tools led you astray (been there, done that many a times, and I promise I'll do it again).
Regards,
Hi Djim,
In the .pdf in Post #718 I tried to make the difference clear. On the left is an overlay drawing of the handdrawing you presented in Post #691. On the right is a drawing of what I assume a SS15-type TH would look like using your provided Hornresp input dimensions (obviously give or take a little). The layout on top is for the drawing on the right (I call it actual).
The one on the left cannot be build, you could build a layout like that, but you would have to use different Hornresp input values - or you could try to match the layout to the Hornresp values, which means you get a different layout (about the one on the right if you use the SS15-style). You just cannot have it both ways.
I have rechecked the drawing and values, and they still look correct. You are asking: "...what am I doing wrong here?...". I would suggest updating your tools. You would find even a rudimentary 2D drafting package to be a lot more accurate than your current method. It just forces you into putting real numbers with the items you draw, and if it has dimensioning capability you can extract just about any angle, line length, area you want to. You can turn layers on and off, that way you only see what you just want to look at.
If you are looking for a low cost version "Solid Edge 2D" is available free from Siemens PLM Software. There is nothing rudimentary about that package its quite nice. I know the learning curve may appear somewhat daunting, but luckily we forget about that after just a little while.
In addition to that you need to use a spreadsheet to verify your calculations, e.g.: duct cross-section v. width w. duct height.
So, I don't think you are doing anything wrong, I think your tools led you astray (been there, done that many a times, and I promise I'll do it again
).Regards,
it looks like you have cascaded a pair of 4pole Butterworth filters to end up with a 6dB cut at the 40Hz and 33Hz.
These are no longer Butterworth, which by definition must be -3dB @ the turn over frequency.
Need a little help, guys. I'm trying understand the finer points of how a HiPass filter affects
the diaphragm displacement below the minimum displacement at 48Hz. I did a little work with HornResp
and it seems to indicate that I can use a 32Hz LR HiPass on the SS15 and do minimum damage to the
40Hz signal.
The d curve was plotted using the b-c intersection and the deflection at 16 Hz with 2 Watts (-24dB).
I know that this could get dangerous if the SS15 deviates from the HornResp simmed values.
Attachments
Yep Andrew they are two 24's in serie, but you also know it doesn't matter. If you set Butterworth or any other kind of 48dB/Oct filters to -3dB at 40Hz for one cab and -3dB at 33Hz you still have 6dB difference at 33Hz. If you count that with the natural roll-off from the SS15 (47Hz) and the Extended (40Hz) you still get that 6dB difference at 40Hz...it looks like you have cascaded a pair of 4pole Butterworth filters to end up with a 6dB cut at the 40Hz and 33Hz.
These are no longer Butterworth, which by definition must be -3dB @ the turn over frequency.
Last edited:
The shape of the roll off for a Butterworth is defined.
A pair of cascaded Butterworth is a different shape of roll off. This can be compared by looking at the Q of the two arrangements.
Butterworth has Q=1/sqrt(2).
cascaded Butterworths have Q=1/2
An 8pole Butterworth can be assembled with a Q=1/sqrt(2). This will have a different rolloff from a Q=1/2 filter.
The cascaded Butterworths are what Linkwitz Reilly use for their cross over.
Don,
I have seen other graphical solutions similar to yours. so I tend to agree that what you conclude is that the 4pole filter protects the driver from over excursion.
I can see from your graphical solution that the Filter (line C turn over frequency) could be moved up in frequency slightly and still protect the driver from over excursion.
A secondary effect is that the heating effect of the filtered LF is also removed from the driver VC.
As an aside,
if the filter slope matched the rise in excursion with lower frequency then the driver excursion would tend towards a horizontal line. Your steeper slope which gives reduced excursion at constant power input gives cooler running for no loss of bass.
Last edited:
hi donNeed a little help, guys. I'm trying understand the finer points of how a HiPass filter affects
the diaphragm displacement below the minimum displacement at 48Hz. I did a little work with HornResp
and it seems to indicate that I can use a 32Hz LR HiPass on the SS15 and do minimum damage to the
40Hz signal.
The d curve was plotted using the b-c intersection and the deflection at 16 Hz with 2 Watts (-24dB).
I know that this could get dangerous if the SS15 deviates from the HornResp simmed values.
this is how i guestimate my hpf.
i simulate a br box with the same driver tuned @the same fs as the th horn minimum excursion in winisd alpha.
ad power to go to x-max/x-damage
then ad a filter then you can see what the excursion does

Last edited:
I used Photoshop to put both designs on top (not my drawing but yours.) and somehow I ended up with something like 6 or 7 inches longer path. But if you checked it I'm sure I have made a mistake somewhere down the line.Hi Djim,
In the .pdf in Post #718 I tried to make the difference clear. On the left is an overlay drawing of the handdrawing you presented in Post #691. On the right is a drawing of what I assume a SS15-type TH would look like using your provided Hornresp input dimensions (obviously give or take a little). The layout on top is for the drawing on the right (I call it actual).
The one on the left cannot be build, you could build a layout like that, but you would have to use different Hornresp input values - or you could try to match the layout to the Hornresp values, which means you get a different layout (about the one on the right if you use the SS15-style). You just cannot have it both ways.
I have rechecked the drawing and values, and they still look correct. You are asking: "...what am I doing wrong here?...". I would suggest updating your tools. You would find even a rudimentary 2D drafting package to be a lot more accurate than your current method. It just forces you into putting real numbers with the items you draw, and if it has dimensioning capability you can extract just about any angle, line length, area you want to. You can turn layers on and off, that way you only see what you just want to look at.
If you are looking for a low cost version "Solid Edge 2D" is available free from Siemens PLM Software. There is nothing rudimentary about that package its quite nice. I know the learning curve may appear somewhat daunting, but luckily we forget about that after just a little while.
In addition to that you need to use a spreadsheet to verify your calculations, e.g.: duct cross-section v. width w. duct height.
So, I don't think you are doing anything wrong, I think your tools led you astray (been there, done that many a times, and I promise I'll do it again
Regards,
I'm looking for a drawing program but everybody seems to use another and I only need it for this kind of work. Google Sketch is not really my thing somehow. What I need is a fast learning curve (Adobe style would be great), output compatibility with CAD, I want to be able to draw simple lines just like in paint, and what i prefer is that I can work straight on the picture also instead of filling endless numbers all the time. Any tips?
Guys I think you are all forgetting something important, the cone can show instabilities under the the 1/3 wavelength and theoretical models are not showing that. And that's beside the fact that music signals are complex and dynamic modulations and also can have big effect on excursion. When you powering to the max these things are important...
Last edited:
Andrew, I made a correction of the two filter types... And as you can see it doesn't matter to the outcome. Instead of 7,5dB difference I stated earlier at 40Hz between the original SS15 and the extended, it is still would end in a 5,8dB difference in favour of the extended and that is almost twice the power...
Attachments
Last edited:
Your bet would loose....and Klipsh was correct, IMO
I'll bet that it can be modelled with Akabak. The topology looks similar to an idea I came up with for modifying a TH to remove the first notch in the output. Search for "Subwoofer Dogfood Duct" to see what I'm talking about. However, modelling it is one thing - coming up with an optimized alignment is another.
I'll bet that the shape of the exit has little to do with the overall FR in the effective passband (i.e. before massive cancellations and peaks show up in the output), and it can be replaced with an equivalent circular cutout.
I tested many dozens of shapes, square, rectangular, "V", and "A" shapes, and varied the exit area of each shape. The differences between each shape and area were all quite measurable in their effect on frequency response both in and out of the pass band.
I did, in fact, try shapes with a close resemblance to the Karlson exit, they did not work as well as the upside down keystone shape.
The choice of the Keystone exit was by no means arbitrary, I have dozens of response curves that show the differences.
If you have more observations or questions regarding my designs, why not post them in one of the threads I started, as this discussion has little to do with the "SS15 challenge".
http://www.diyaudio.com/forums/subwoofers/184992-tapped-horn-vs-bass-reflex-case-study.html
Art
Last edited:
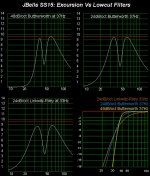
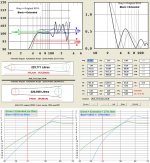
Don, I have checked your 32Hz about the SS15 and I found 33Hz but that is a minor difference. I modelled 3 types for safe filtering the SS15 and used Xmax as guideline for excursion.Need a little help, guys. I'm trying understand the finer points of how a HiPass filter affects the diaphragm displacement below the minimum displacement at 48Hz. I did a little work with HornResp and it seems to indicate that I can use a 32Hz LR HiPass on the SS15 and do minimum damage to the 40Hz signal. The d curve was plotted using the b-c intersection and the deflection at 16 Hz with 2 Watts (-24dB). I know that this could get dangerous if the SS15 deviates from the HornResp simmed values.
One strange thing showed up and that is the difference between 24dB/oct and 48dB/oct Butterworth filtering. Both end up at the same frequency for the SS15 as you can see. I aspect if the cab had a lower Fs it would not longer end at the same frequency.
About the 'damage' your Linkwitz-Riley filter is causeing at 40Hz you can see in the graph in the right under corner. It shows more then 3dB 'damage' at 40Hz.
Also if you compare Linkwitz-Riley with Butterworth you’ll see the Linkwitz does harm the signal above its filter freq quiet a lot and how that results in the dropping of the excursion. However, if you are going to use eq at 40Hz for "make up for the damage" it is advisable to use higher settings as given.
I hope this answers your and maybe even more Jbells question.
Attachments
Last edited:
I hope this answers your and maybe even more Jbells question.
You know.... I never spent the time to check xmax with different HP filters... I just always assumed steepest slope at my desired cutoff. The stadiumhorn I used a LR48@40hz because it has a 40hz hump and that flattened it out, the SS15 I used a BUT48@40hz because the LR took too much of the already reduced 40hz out... But that's as much thought as I'd given it.
Looks like LR24@33hz would be a great option, and would let some of the filtered 'below 40' content add a bit to the cooling of the coil, and might be beneficial.
I think the ss15 is ending up being one of the most investigated/detailed DIY designs around.
Thanks to all.
Ending Jim? ...I think the ss15 is ending up being one of the most investigated/detailed DIY designs around.
Thanks to all.
...
Xoc 1 tweeks
I played around with the model / drawing that I posted in post 711.
This is as smooth as I can get with this layout - Horn shape emulates a quarter section of an ellipse so as usual Hornresp is an approximation
Overall height / volume is slightly more.
All parts layed out on a single sheet with no cutting allowances as Jbells
I envisage slightly deeper bass and more output from 60 to130 Hz
Have a look and see what you think!
Regards
Martin
Attachments

Thanks guys, I learned lots about filters (but still have much to learn). Special thanks to EPA, Andrew & Djim. My drawing was not very accurate
but it did help define the problem.
Speaking of drawings, several people have asked for suggestions for CAD packages. I have used CADAM, UNIGRAPHICS and CATIA. In order to do
anything complex, the 2D packages require expertise in descriptive geometry. Currently, most Mechanical/Aeronautical Engineering students bypass the
descriptive geometry, and go straight to 3D CAD.
For home use, EasyCAD by FastCAD.com works for me. It allowed me to model Danley's LABHorn, including the compound flare in the throat. It is not
an easy program to master ... no CAD package is. If projections and descriptive geometry is in your field of expertise, use EasyCAD ... otherwise
look into SketchUp.
- Home
- Loudspeakers
- Subwoofers
- Single sheet TH challenge