HiI decided to have a go at plotting out the horn dimensions 'as drawn'
your constriction seems to assume that the entry width into a bend is similar in width to the exit from the bend.
Surely, if one takes account of the length of taper in the bend that the exist should have width defined by that taper. An expanding taper would automatically lead to the exit width being wider than the entry width.
At mid point in the bend the width from the tip of the divider board to the outside wall of the bend should also take account of the length and taper required.
The width at ~45degress to the axial line will be larger, if no fillet is inserted into the corner. Omitting that fillet only makes for a bigger area not a constriction.
There are two constricted spots in the horn. You can clearly see them in Xco1 and my straightened horn pics.
They have nothing to do with the extra corner areas. The ~20cm drop down from the top is too long, and the last corner is smaller at the mouth side.
I'm not quite sure why he used a mid section S3 with a smaller than present Sd, however.
They have nothing to do with the extra corner areas. The ~20cm drop down from the top is too long, and the last corner is smaller at the mouth side.
I'm not quite sure why he used a mid section S3 with a smaller than present Sd, however.
Last edited:
There are two constricted spots in the horn. You can clearly see them in Xco1 and my straightened horn pics.
They have nothing to do with the extra corner areas. The ~20cm drop down from the top is too long, and the last corner is smaller at the mouth side.
I'm not quite sure why he used a mid section S3 with a smaller than present Sd, however.
If the 20cm drop from the top is too long, what will be the preferred length? And how much influence wil it have?
Hi,
In Post #74 I posted the updated version of the singlesheet enclosure, now called SS15. Jbell approved it in Post #78. It is what it is, what is still in question is why should there be a difference in model response and measurement. If you even out the taper by changing dimensions you are creating a new speaker. There is already at least one minor change in Xoc1's very nice drawing, the front baffle should be slightly inset into the box.
Regards,
It is what it is, what is still in question is why should there be a difference in model response and measurement.
...because we're looking at measurement techniques that are possibly flawed.
FR measurement @10M with 28.3V = nice for confirming peak output, less useful for confirming alignment with a model based on SMALL signal parameters
FR measurement @1M with 2.83V - is this a valid way of measuring the FR of a horn?
What's missing here is the impedance response. It's easy to measure (with a WT3 or something similar), it's more accurate, and it will indicate clearly not only if there's alignment with the model, but if there are other issues that may be contributing to misalignment (e.g. panel flex).
It's not really worth worrying about. It is a minor thing, but it is present in the SS15.If the 20cm drop from the top is too long, what will be the preferred length? And how much influence wil it have?
Where are the 1w/1m measurements showing something else?It is what it is, what is still in question is why should there be a difference in model response and measurement.
All I have seen is jbell's 28v@10/m Smaart plot, with a 180Hz LP xover. It follows the HR graph as well as I would expect with a large signal being used. Harmonics 1, 3, 5, and 7 are were they should be, with 5 and 7 being rolled off by the xover. 7 more then 5.
I remember some questioning of the 40-50Hz area rolloff, but this is nothing more than an issue of comparing a small signal sim to a large signal reality. You are seeing an decrease in rolloff due to the greater pressures in the horn that are loading it better down low.
Yes, unless the horn mouth radius * .5 is 1m or more.FR measurement @1M with 2.83V - is this a valid way of measuring the FR of a horn?
I remember some questioning of the 40-50Hz area rolloff, but this is nothing more than an issue of comparing a small signal sim to a large signal reality. You are seeing an decrease in rolloff due to the greater pressures in the horn that are loading it better down low.
really.... ?????
EVERY box, I've ever tested is worse down low on a 28v10m test vs a 2.8v1m test. If for no other reason than power compression is kicking in. Most boxes when tested 28v@10m quite honestly suck compared to their 2.8v1m readings.
You're saying it's expected to get more output at 28v10m than at 2.8v1m ?? sounds voodoo to me... wonder how I research this???
If there weren't a foot of snow at the moment... I'd bring smaart outside and verify a 2.8v reading.
Last edited:
I never said it was always expected.You're saying it's expected to get more output at 28v than at 2.8v ?? sounds voodoo to me... wonder how I research this???
")
Have I seen it before in a horn? Yes.
I never said it was always expected.
Have I seen it before in a horn? Yes.
wow... this is a first for me.
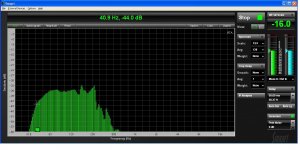
When you said this awhile back, I blew it off as crazy talk... but now you've got me second guessing. Hornresp says it should be a 24db/oct fall from 60hz on down. This clearly shows it is about a 12db/oct drop from 60-40hz, and then a 24db/oct drop from there.
And you are really saying that this could be caused from 'better loading' at large signal vs small signal???
And the consequence of saying that: Part of the reason that Tom's charts on DSL beat the pants off of the competition is that he tests at 28v10m... and if only the competition knew that.... then they could compete. (not being serious here....)
Last edited:
I think "different loading" would be a more correct way to put it here.
"Better" was a bad choice on my part. I said, "You are seeing an decrease in rolloff due to the greater pressures in the horn that are loading it better down low." I was speaking about the straight FR to FR profile comparison there. What I meant was that the loading differences make it graph better here.
"Better" was a bad choice on my part. I said, "You are seeing an decrease in rolloff due to the greater pressures in the horn that are loading it better down low." I was speaking about the straight FR to FR profile comparison there. What I meant was that the loading differences make it graph better here.
I think "different loading" would be a more correct way to put it here.
"Better" was a bad choice on my part. I said, "You are seeing an decrease in rolloff due to the greater pressures in the horn that are loading it better down low." I was speaking about the straight FR to FR profile comparison there. What I meant was that the loading differences make it graph better here.
different, better, whatever... I've not met a dj yet who runs his subs at 2.83 volts....
Still unbelievable to me that at volume would be anything other than worse compared to 2.83 volts.
Jbell,different, better, whatever... I've not met a dj yet who runs his subs at 2.83 volts....
Still unbelievable to me that at volume would be anything other than worse compared to 2.83 volts.
Having done quite a bit of testing, I have found no appreciable difference between one watt and 100 watt tests of subs unless the speaker is not capable of 100 watts without exceeding Xmax, or is leaky or not well braced.
Testing with the microphone on the ground at 10 meters is advisable for subs, especially large sized subs or arrays, where directivity can make one meter tests not representative of actual response (other than at one meter ;^).
The sine wave testing measurements of your one sheet sub are encouraging, have you checked it against any other “known quantities” ?
A comparison with the same speaker in a sealed or ported box would be a good “reality check”.
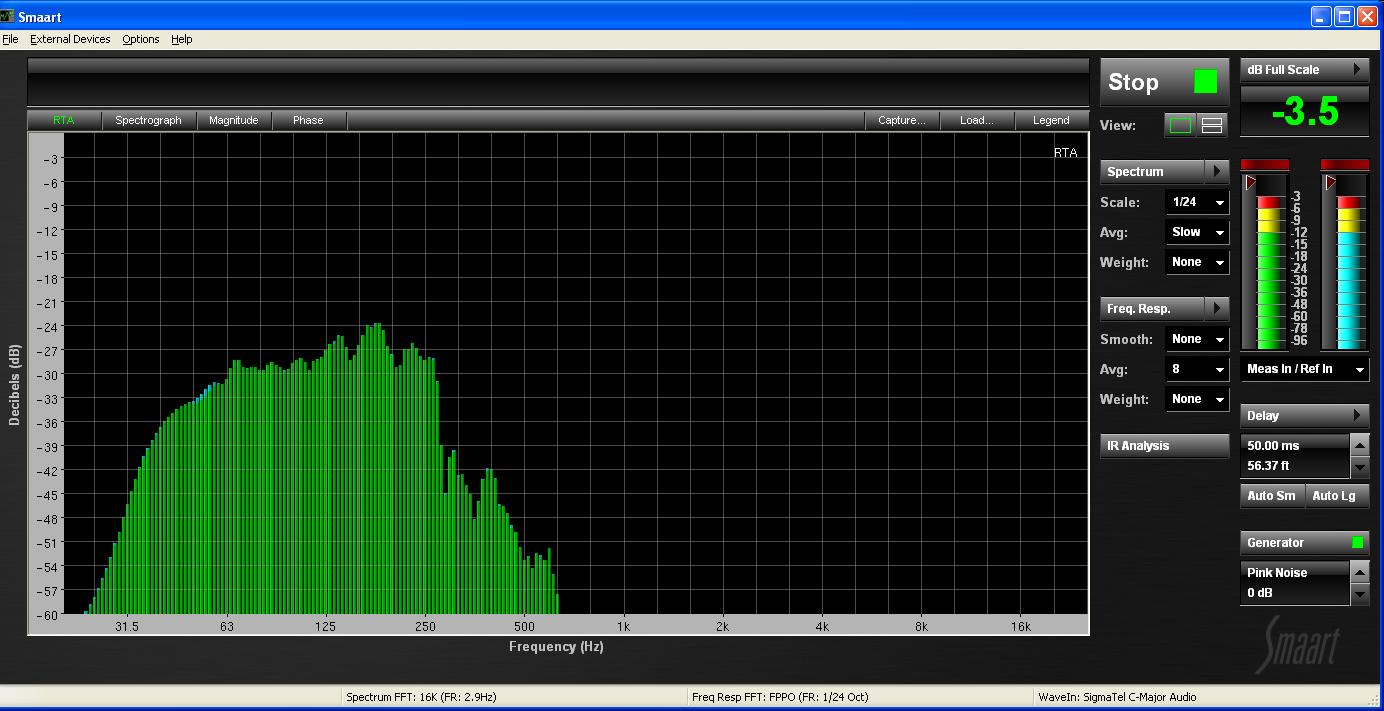
The Smaart RTA chart you showed shows 40Hz more than 6 dB down from the 63-125 range, if 40hz is actually 98.5 dB, and 100hz at 104.5, that is a quite impressive 5 dB gain in sensitivity over a similar sized Fb 44 Hz box.
That said, the ported box can take 400 watts without exceeding Xmax (9.6mm a bit more than 3/4 inch peak to peak), what is the excursion like with the tapped horn at 400 watts (58 volts)?
The 3015LF in a ported box can do 125 dB with 400 watts, what is the max you have read with the tapped horn in the 50-100 Hz range?
Art
Last edited:
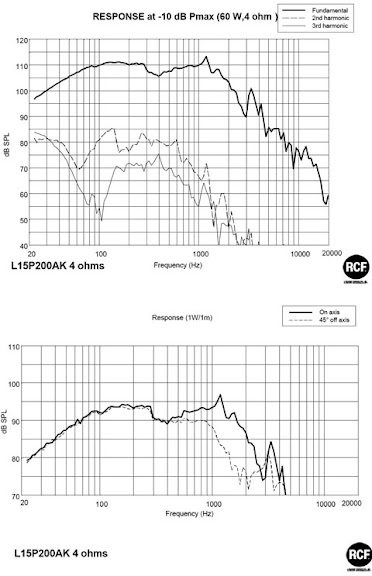
Not just horns can give better results with 100w/1m. Most PA loudspeaker manufactures give SPL responses of 1w/1m because this was and still is the AES standard for measuring loudspeakers under controlled circumstances. And it works in favour for some to produce 'better' results. Manufactures like RCF for instance provide charts with -10dB Pmax SPL responses to manufacturers if requested. It is not unfamiliar those readings give better results. So it’s not just a horn thingy! They suppose to produce the best results at -10dB Pmax, don’t they?!
That’s the reason why serious manufactures of PA loudspeakers prefer to look at a more real world circumstances at 100w/10m for instance. Or even more fair in my view: -10dB Pmax at 10m (most time the point where serious power compression starts to take place). Then I would like to see the competition between brands like RCF, 18Sound, B&C, Beyma, and others like eminence for instance. We could immediately see who’s fair and who isn’t. power compression would become a real deal with those measurements! Although maybe some drivers would perhaps die before giving those results... But hey, since people demand those 1w/1m charts why not giving them and come up with some crazy pwr ratings, non realistic Xmax numbres, and who cares about power compression and get away with it.
So Jbell, I get it why you prefer to measure at 100w/10m and hope to see more of those charts...
That’s the reason why serious manufactures of PA loudspeakers prefer to look at a more real world circumstances at 100w/10m for instance. Or even more fair in my view: -10dB Pmax at 10m (most time the point where serious power compression starts to take place). Then I would like to see the competition between brands like RCF, 18Sound, B&C, Beyma, and others like eminence for instance. We could immediately see who’s fair and who isn’t. power compression would become a real deal with those measurements! Although maybe some drivers would perhaps die before giving those results... But hey, since people demand those 1w/1m charts why not giving them and come up with some crazy pwr ratings, non realistic Xmax numbres, and who cares about power compression and get away with it
.So Jbell, I get it why you prefer to measure at 100w/10m and hope to see more of those charts...
Last edited:
So Jbell, I get it why you prefer to measure at 100w/10m and hope to see more of those charts...
+1
Response comparisons at maximum safe output would be very interesting! Then we could decide even better which speaker and cabinet to use for which purpose.
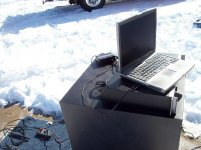
Ok... since there has been much talk spent on 28v vs 2.83v measurements.... And I'm a fan of 'There is no substitute for doing...' I went and did something a bit crazy today.
The crown was set for 40-300hz. (and yes, even a butterworth 48db/oct at 40hz cuts a couple db at the high pass freq.)
The pictures speak for themselves.
The crown was set for 40-300hz. (and yes, even a butterworth 48db/oct at 40hz cuts a couple db at the high pass freq.)
The pictures speak for themselves.
Attachments
Last edited:
Ok... since there has been much talk spent on 28v vs 2.83v measurements.... And I'm a fan of 'There is no substitute for doing...' I went and did something a bit crazy today.
The crown was set for 40-300hz. (and yes, even a butterworth 48db/oct at 40hz cuts a couple db at the high pass freq.)
The pictures speak for themselves.
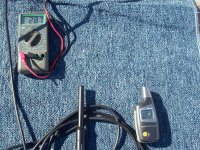
Hmm... does that meter read true RMS?
Ok... since there has been much talk spent on 28v vs 2.83v measurements.... And I'm a fan of 'There is no substitute for doing...' I went and did something a bit crazy today.
The crown was set for 40-300hz. (and yes, even a butterworth 48db/oct at 40hz cuts a couple db at the high pass freq.)
The pictures speak for themselves.
Not sure what the pictures are saying, other than the 3 dB down point with the 40Hz filter is now about 55 Hz, and the 10dB down point 40 Hz.
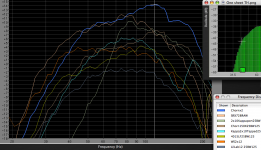
Using magnitude response at 32K FFT would show the narrow peaks and valleys that can hide in the grass with the RTA, and allow easy comparisons on one screen.
Does the response look different at 1 watt one meter compared to 100 at 10 meters?
What distance is this test from the nearest walls?
Attachments
Hmm... does that meter read true RMS?
nope... so you want to take that reading and multiply by .707?
That'll make the numbers look even better....
That was at the end of my sidewalk... about 20' from the house, nothing in front for about a half mile. You can see the toyota off to one side, that's about it.
The pic a few posts back (#331) was 28v10m, I don't see much difference to what I did today.
excuse the 'non-scientific' measurement that was obviously rushed.... it was cold, and snowy, but at least no wind.
Last edited:
- Home
- Loudspeakers
- Subwoofers
- Single sheet TH challenge