Hello Mimura,
No it will not affect the simulation, only the graph of the phase is more difficult to read when there is a 180° phase reversal.
Best regards from Paris, France
Jean-Michel Le Cléac'h
No it will not affect the simulation, only the graph of the phase is more difficult to read when there is a 180° phase reversal.
Best regards from Paris, France
Jean-Michel Le Cléac'h
Hello David and all the members.
Thanks for the help. I do not know if it will affect projects that are going to do it. I do not know much about such details.
Thank you for good.
Hi David,
I'll attach a screen print of some notes in a spreadsheet. Using these values seems to work well enough. Please, let me know if you find any big mistakes.
Regards,
Hi Oliver,
I found no mistakes..but maybe a very small one(I too do sometimes
 ) unless you forgot to nullify your Fluke (8060A?) when measure the Re of the drivers using the 200 Ohm scale, of course.
 b
I'm using ADSL2+. If I wait long enough I get the "Web page is not Available"message. I've been trying for three days now - same result each time.
Hi jamikl,
Sorry, but I have no idea why you can no longer access the Hornresp webpage.
Not sure if it will make any difference, but you could try the following alternative address:
Hornresp
Kind regards,
David
I'll attach a screen print of some notes in a spreadsheet. Using these values seems to work well enough. Please, let me know if you find any big mistakes.
Hi Oliver,
Many thanks for the information - I had suspected that you were probably using this method, but I wanted to be sure. It has been documented in a number of places, and is presumably based on the isobaric model originally described by Marshall Leach in his book "Introduction to Electroacoustics and Audio Amplifier Design". Unfortunately, as far as I can see, he got it wrong, and everyone else has just propagated the error
.I simply cannot see how fs can stay the same...
fs = 1 / (2 * Pi * (Mms * Cms ) ^ 0.5)
where Mms = Mmd + airload
For an isobaric pair, Cms = Cms / 2 and Mmd = Mmd * 2. For fs to remain the same, the airload mass would also have to double. This does not happen - the airload mass is increased slightly due to the inclusion of the cavity between the two diaphragms, but that is all.
The fs for an isobaric pair will therefore be higher than that for a single driver.
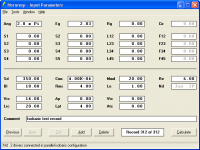
To illustrate, assuming that Cms = 0.0004 metres per newton, Mmd = 0.04 kilogram, front and back airload mass = 0.01 kilogram and isobaric cavity airload mass = 0.001 kilogram, then:
Single driver fs = 1 / ( 2 * Pi * ((0.04 + 0.01) * 0.0004) ^ 0.5) = 35.59 hertz
Isobaric pair fs = 1 / ( 2 * Pi * ((0.08 + 0.01 + 0.001 ) * 0.0002) ^ 0.5) = 37.31 hertz
The fs shift can be readily see in AkAbak using the complete isobaric model - see attached comparison.
Because fs changes, so too will Qes and Qms.
If anyone can see a flaw in my reasoning, could they please let me know.
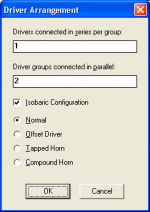
Using the technique I described earlier for Hornresp should lead to more accurate predictions than those obtained with your current method. To make things easier for users, I will probably now add an isobaric configuration option to the Driver Arrangement tool, as you have suggested
.Kind regards,
David
Attachments
A starting point reference is single coil DVC TS parameters that can be found here:
Thanks bjorno. Please see my post above.
Kind regards,
David
Post #2564
Hi David,
Thanks so much for your effort of looking into this. At least I seem to be in good company with my mistaken assumptions. I hope to be able to-again-get to some practical measurements in the near future, and I will definitely let you know how they come out. Meanwhile, I'm looking forward to the isobaric feature in Hornresp.
Regards,
Whoo Hoooo!Using the technique I described earlier for Hornresp should lead to more accurate predictions than those obtained with your current method. To make things easier for users, I will probably now add an isobaric configuration option to the Driver Arrangement tool, as you have suggested
Can you throw in a multiple vent calculator while you are at it Sensei McBean?
I have all but given up in using WinISD. And I will very shortly present the findings I have been working on vent velocity predictions versus simulations from Hornresp. One last round of verification this evening.
.jpg")
Oh I have to put this up. I just did a back loaded horn design that performs very admirably. And exactly as predicted. Thanks David. Without your work mine becomes so much harder. You are very much appreciated.
David,For an isobaric pair, Cms = Cms / 2 and Mmd = Mmd * 2. For fs to remain the same, the airload mass would also have to double. This does not happen - the airload mass is increased slightly due to the inclusion of the cavity between the two diaphragms, but that is all.
The fs for an isobaric pair will therefore be higher than that for a single driver.
Because fs changes, so too will Qes and Qms.
If anyone can see a flaw in my reasoning, could they please let me know.
I don’t see a flaw in your reasoning that the isobaric pair Fs would increase slightly.
Made me recall the opposite happening with "normal" parallel speakers.
The TS parameters on the specification sheet for the Electrovoice EVX-150 15 inch woofer state a single driver having 35 FS, .251 QTS.
The spec sheet also says “Multiple driver application: When used in arrays and multiple bass boxes, the system Theile-Small parameters can be synthesized as follows:
For two drivers the FS drops to 34, QTS .260, and for four, FS is 32.5, QTS .270.
Do the formulas used for multiple speakers in Hornresp also predict a lower FS and a rising QTS?
Art
where can I buy the mentioned programme "Hornresp 18.20"?
That would be an older version, David's Hornresp is up to:
Version 28.90 - Product Number 2890-120205
Hornresp
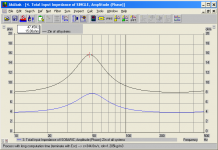
Still the problem of the inverted phase on the phase graph ... (wrap around + and -180° and not around 0°).
Hi Jean-Michel,
I found that I had to modify your Matlab code as shown below to fix the wrapped phase display. Do you see any problems in my doing this? The change does not affect the impulse response.
Your original code:
%***********************************************
% set phase between -pi and +pi for graph output
%***********************************************
S1 = 0.0; S2=0.0;
for I = Imag1 : Imag2;
S1=S1+(PUNW(I)^2); S2=S2+(abs(PUNW(I))-2.35)^2;
end
if S2>S1;
for I = 1 : Nfreq;
PUNW(I) = PHASE(I)- Dphase*FREQ(I);
PUNW(I)=PUNW(I)-2*pi*fix(0.5+(PUNW(I)/2/pi));
end
else
for I = 1 : Nfreq;
PUNW(I) = pi+( PHASE(I)- Dphase*FREQ(I));
PUNW(I)=PUNW(I)-2*pi*fix(0.5+(PUNW(I)/2/pi));
end
end
My modified code:
%***********************************************
% set phase between -pi and +pi for graph output
%***********************************************
for I = 1 : Nfreq;
PUNW(I) = PHASE(I)- Dphase*FREQ(I);
PUNW(I)=PUNW(I)-2*pi*round((PUNW(I)/2/pi));
end
Thanks and kind regards,
David
Thanks David, the alternative address worked fine.
Hi jamikl,
That is excellent news. Thanks for letting me know.
Kind regards,
David
Can you throw in a multiple vent calculator while you are at it?
Hi Mark,
Sorry, that is getting just a bit too specialised for Hornresp
. While I haven't looked closely at what might be involved, I have a sneaking suspicion that it is probably not a trivial exercise to accurately take multiple ports into account. Setting Ap to the equivalent total area is the best that you can do in Hornresp...Kind regards,
David
Last edited:
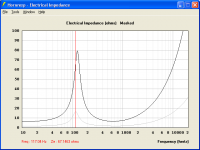
Do the formulas used for multiple speakers in Hornresp also predict a lower FS and a rising QTS?
Hi Art,
Yes. The attached screenprint shows the predicted system fs for four speakers connected in parallel (gray trace), compared to the fs for a single speaker (black trace). Because fs is lower, the system Qts will be higher.
Kind regards,
David
Attachments
Hello David,
In fact my code is perfoming 2 different things :
1 : a test to analyse the wrapped phase inside the useful part of the response to see if the signal is in the positive polarity (S2 > S1) or in the opposite polarity (S1>S2). In the case the test detect a reversal of polarity then 180° is added to the phases.
2 : the phase unwrapping
Your code only performs the phase unwrapping without applying any prior 180° rotation of the phase when the signal is in opposite polarity as there is no detection of such.
From memory the code I wrote for the calculation of the impulse response in Hornresp which is based on wavelets synthesis doesn't use the phase but the group delay, so the correct polarity of the impulse.
Best regards from Paris, France
Jean-Michel Le Cléac'h
Hi Jean-Michel,
I found that I had to modify your Matlab code as shown below to fix the wrapped phase display. Do you see any problems in my doing this? The change does not affect the impulse response.
David
Last edited:
In fact my code is perfoming 2 different things :
Hi Jean-Michel,
Thanks for your comments.
I think I will try the modified code for a while and see how things go.
If problems do arise I can easily swap back to your original code.
Kind regards,
David
Last edited:
- Home
- Loudspeakers
- Subwoofers
- Hornresp