Brian,If that was the case, HornResp's impedance response predictions will not match real life measurements for THs. I can confirm that this is not the case - the predicted impedance response is a very close match to what I've actually measured.
I don’t doubt HornResp's impedance response predictions, other than they may be a bit higher Q than reality, just as the frequency response dips and peaks predictions are also overstated compared to the measured response.
Impedance and excursion curves are closely related, I have found the predicted excursion response is a close match to what I've measured.
Not owning a proper impedance measurement device, and finding the VOM resistor method very time consuming to get accurate results using the meters I own, I have not done any actual TH impedance measurements.
Why would a dual lumped air mass impedance model not closely match a cylindrical horn impedance model ?
Art
Why would a dual lumped air mass impedance model not closely match a cylindrical horn impedance model ? [/quote
I'm not sure why there's a difference, but there clearly IS a difference. That's how I detected something was amiss with HornResp - the predicted impedance plot when I modelled a vented box as a rear-loaded horn did not match the impedance plot of the same vented box modelled as a vented box. For example, predicted "Fb" was a lot higher than expected in the "horn" model.
In the case of my POC TH, the predicted impedance response was a very close match for what I measured, so by extension the "horn" model is the more accurate model to use, at least for THs the size of my POC.
Hi david,
Just came home from work and reread the Leach paper. You´re so right, it is Mmd that is used. Have to check the spreadsheet again as I think Mms is used for calculating VAS and Mmd is calculated for the horn design. Couldn´t be otherwise as our simmed results seems to be so close.
Just came home from work and reread the Leach paper. You´re so right, it is Mmd that is used. Have to check the spreadsheet again as I think Mms is used for calculating VAS and Mmd is calculated for the horn design. Couldn´t be otherwise as our simmed results seems to be so close.
Have anybody idea what is going to happen if I set driver out of line? effect to a frequency response? There is a way to make box with in line driver, but there is more complex shapes of the box.
ps. sorry my bad English skills
An externally hosted image should be here but it was not working when we last tested it.
ps. sorry my bad English skills
Last edited:
Brian,Why would a dual lumped air mass impedance model not closely match a cylindrical horn impedance model ? [/quote
I'm not sure why there's a difference, but there clearly IS a difference. That's how I detected something was amiss with HornResp - the predicted impedance plot when I modelled a vented box as a rear-loaded horn did not match the impedance plot of the same vented box modelled as a vented box. For example, predicted "Fb" was a lot higher than expected in the "horn" model.
In the case of my POC TH, the predicted impedance response was a very close match for what I measured, so by extension the "horn" model is the more accurate model to use, at least for THs the size of my POC.
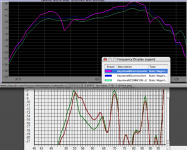
The response curve changes of our THs with an adjacent, un-shorted, un-driven cabinet are perhaps of interest in this discussion.
LF corner boost, followed by upper dip, then another boost.
The effect seems to be more dramatic with your indoor test due to the tight scale you use, but the results are actually pretty similar when compared to the frequency response.
At a glance, this seems to be a Helmholtz (vented box), rather than a horn type attribute.
Have you done outdoor measurements of your POC TH in singles and multiples ?
Art
Attachments
Hi David,
You must help me out here. I can´t find Mmd neither Cms being used anywhere in the calculations in the paper.
In my spreadsheet Mms is used twice, when calculating VAS and when calculating Qes. Both being standard Small-Thiele equations.
Also checked my VAS-version where Mms is used only in calculating BL. This is done using the Small-Thiele Qes-equation.
Have anybody idea what is going to happen if I set driver out of line? effect to a frequency response? There is a way to make box with in line driver, but there is more complex shapes of the box.
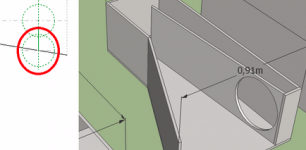
Your red circle would require the driver sticking half way out the side of the horn mouth, not what your cabinet drawing shows. The cabinet drawing also shows the driver being as close as possible to the mouth, while the diagram with the red circle shows it almost 1/2 driver width from the mouth, in other words L45 is longer in the simulation compared to the cabinet drawing.
Changing a circular Hornresp simulation to a rectangular shape will never result in an exact frequency response match, but I don’t think your particular box shape measured response will be much different than what the Hornresp model predicts (if you get the model cross sectional areas and driver position the same as the cabinet), other than the usual variations between predicted and measured.
Art
Attachments
At a glance, this seems to be a Helmholtz (vented box), rather than a horn type attribute.
I would not be surprised if the effect shows up with horns as well.
Have you done outdoor measurements of your POC TH in singles and multiples ?
I've done outdoor measurements, but alas, I only have one POC TH
") .
.Your red circle would require the driver sticking half way out the side of the horn mouth, not what your cabinet drawing shows. The cabinet drawing also shows the driver being as close as possible to the mouth, while the diagram with the red circle shows it almost 1/2 driver width from the mouth, in other words L45 is longer in the simulation compared to the cabinet drawing.
They were just examples. There is no connection between these two pictures.
Thanks for the reply
Unable to use air space in mouth side of driver in THs
Hornresponse gives unable to do response in THs. Trying to model THs with air space in both sides of driver to see if limiting higher frequencies especially in mouth side driver allowed more extended freq response and or flatter less peaky upper freq response. As I see it seems the upper freq from the mouth side driver returning from the apex 180 degree out of phase are interfering with the upper freq response. Is this the primary problem explaining the ragged response OR is it is it the harmonics of the fundamental being produced within this closed end horn causing the problem. By limiting the mouth side upper freq I was hoping to find out . Does anyone already know the answer?? David??
Hornresponse gives unable to do response in THs. Trying to model THs with air space in both sides of driver to see if limiting higher frequencies especially in mouth side driver allowed more extended freq response and or flatter less peaky upper freq response. As I see it seems the upper freq from the mouth side driver returning from the apex 180 degree out of phase are interfering with the upper freq response. Is this the primary problem explaining the ragged response OR is it is it the harmonics of the fundamental being produced within this closed end horn causing the problem. By limiting the mouth side upper freq I was hoping to find out . Does anyone already know the answer?? David??
What is mechanism for the ragged and limited frequency extension in THs
Trying to model THs with air space in both sides of driver to see if limiting higher frequencies especially in mouth side driver allowed more extended freq response and or flatter less peaky upper freq response. As I see it seems the upper freq from the mouth side driver returning from the apex 180 degree out of phase are interfering with the upper freq response. Is this the primary mechanism explaining the ragged limited frequency extension OR is it is it the harmonics of the fundamental being produced within this closed ended horn causing the problem. By limiting the mouth side upper freq I was hoping to find out . Does anyone already know the answer?? David??
Trying to model THs with air space in both sides of driver to see if limiting higher frequencies especially in mouth side driver allowed more extended freq response and or flatter less peaky upper freq response. As I see it seems the upper freq from the mouth side driver returning from the apex 180 degree out of phase are interfering with the upper freq response. Is this the primary mechanism explaining the ragged limited frequency extension OR is it is it the harmonics of the fundamental being produced within this closed ended horn causing the problem. By limiting the mouth side upper freq I was hoping to find out . Does anyone already know the answer?? David??
FWIW, if you check my worksheet out, the last version uploaded has an equation to calculate Mmd from Mms and the Sd.I admit the Spreadsheet is wrongly written about Mmd in the export to Hornresp. Mmd should best be calculated in Hornresp. So I will remove the speaker data and only export the horn and volume data.
It was either dead on, or within a hair of what Hornresp calculated for the dozen or so drivers I checked.
In my spreadsheet Mms is used twice, when calculating VAS and when calculating Qes.
Hi Lars,
In Hornresp, Vas is calculated using Sd and Cms, and Qes is calculated using fs, Cms, Re and Bl:
Vas = Air_Density * Sound_Velocity ^ 2 * Sd ^ 2 * Cms
Qes = 1 / (2 * Pi * fs * Cms) * (Re / Bl ^ 2)
Mms can determined if necessary, as follows:
Mms = 1 / ((2 * Pi * fs) ^ 2 * Cms)
Kind regards,
David
When using formula 49 and 50 we arrive at Leach´s Mmd actually being equivalent to Small/Thiele´s Mms.
Hi Lars,
Now that is a bit confusing
.Kind regards,
David
Trying to model THs with air space in both sides of driver to see if limiting higher frequencies especially in mouth side driver allowed more extended freq response and or flatter less peaky upper freq response.
Hi rafaro,
You will need to use AkAbak.
As far as I am aware, including a chamber on the mouth side of the driver is unlikely to make much of an improvement to the overall performance of a tapped horn system. I would be happy to be proven wrong, however
.Kind regards,
David
Vas = Air_Density * Sound_Velocity ^ 2 * Sd ^ 2 * Cms
Qes = 1 / (2 * Pi * fs * Cms) * (Re / Bl ^ 2)
Mms can determined if necessary, as follows:
Mms = 1 / ((2 * Pi * fs) ^ 2 * Cms)
Hi David
Hard to remember it all as I did it in 2008. Will dig deeper in the spreadsheet and also check the Vas-version where Bl is calculated. Did it as Altec don´t show this in their data.
Those will give the same result as mine as I understand even if I didn´t use Cmsand insted used the S-T Fs formula. When doing Vas I made the faktor 14 from "Air_Density * Sound_Velocity ^ 2". Will change that as Sound Velocity can be coosen the spreadsheet.
Still mysterious about Mms=Mmd
. Hi soho54
As said above Marshall Leach uses Mms, not Mmd. Maybe he just made a typo. Will check your Mmd formula anyway. Saw you use the the same style of balancing out Fl and Fo. Do you use Mmd when calculating Hypex?
Last edited:
Hi soho54
As said above Marshall Leach uses Mms, not Mmd. Maybe he just made a typo. Will check your Mmd formula anyway. Saw you use the the same style of balancing out Fl and Fo. Do you use Mmd when calculating Hypex?
I only have Mmd in there for a Hornresp simulation export function I never finished.
The rest of the page uses Mms.I had a couple of people asking for a way to export the Excel file info into Hornresp Import format. I got about half way through with it, and they said "never mind," as they had gotten good at transferring the info over.
I though you might be able to use it to keep your Hornresp input section intact.
- Home
- Loudspeakers
- Subwoofers
- Hornresp