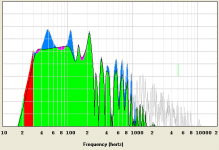
Think of it as two graphs in one. You set an Xmax limit, and a Voltage limit.
HR then adds Voltage at each frequency until one of the two limits is reached. If it runs out of Xmax first it is indicated by a Red line point. If it hits the Voltage limit first it is marked Black.
HR then adds Voltage at each frequency until one of the two limits is reached. If it runs out of Xmax first it is indicated by a Red line point. If it hits the Voltage limit first it is marked Black.
Hi NEO Dan,
Just to clarify, you actually set an Xmax limit and an input power limit. The voltage varies with frequency for a given constant input power because of the reactive nature of the impedance load.
See the Maximum SPL description on page 14 of the Help file for details.
Kind regards,
David
You set an Xmax limit, and a Voltage limit.
Just to clarify, you actually set an Xmax limit and an input power limit. The voltage varies with frequency for a given constant input power because of the reactive nature of the impedance load.
See the Maximum SPL description on page 14 of the Help file for details.
Kind regards,
David
Last edited:
Ahh thanks David,
Now I see what the tool is for, thermal vs displacement.
Which brings me back to my original point, which I didn't make very well.
Folks are using this tool for comparison of displacement limited power handling. But if I understand the way the tool works the simulation is that of a current source because it has no notion of nominal impedance and there for cannot "set" a voltage. In common usage speakers are driven by voltage source amps instead of current sources like industrial amps for MRI field coils, I've heard the behavior is quite different. If my understanding of the situation is not flawed the result we currently see is not representative of real world usage scenario's. For example when driver excursion and impedance are high at the same frequency; I belive the simulation would allow for much more voltage to be applied into the impedance peak to produce the desired "power" level this would potentially produce a false indication of over-excursion when in reality you'd have clipped the amp and run out of power.
As labeled the tool is valid, however I do think it is commonly misinterpreted and I think the option to toggle to a drive voltage mode of would be a more useful feature.
---
Added:
Basically I think it should function as the main input screen in HR already does with the same power calculation subroutine for a voltage input box.
Last edited:
It is displacement limited power handling, only it is per frequency instead of per frequency response.
You can get a FR voltage limited graph using the rest of the HR program. It is really easy with the wizard. Just use the displacement graph, and add voltage until it hits the displacement limit, switch back over to Response, and there you go.
Run both, and you will find you get the same SPL:Voltage point using the lowest red frequency in the passband in the Maximum SPL graph, and following the voltage:displacement method.
The HR Maximim SPL method also gives you the EQ limits, the other version doesn't on its own.
Bug Fix
Hi Everyone,
The bug identified by GM has now been fixed. The latest Hornresp release is Product Number 2830-110211.
Kind regards,
David
Hi Everyone,
Thanks GM. I will have a look at the data and let you know by return e-mail if I find anything.
The bug identified by GM has now been fixed. The latest Hornresp release is Product Number 2830-110211.
Kind regards,
David
I will have a look when I get a chance.
Hi Brian,
I remembered why the throat adaptor entry only has a conical expansion
") . The constraint was applied so that the suite of Directivity tools can still be used with single-segment horns, even though a throat adapter entry might be specified. The way that the Hornresp directivity model works, this would not be possible otherwise.
. The constraint was applied so that the suite of Directivity tools can still be used with single-segment horns, even though a throat adapter entry might be specified. The way that the Hornresp directivity model works, this would not be possible otherwise.By way of background, the throat adaptor entry was really intended to be used as part of the specification of a mid-range compression driver. In most cases the adaptor expansion rate for a practical 'real-world' compression driver will be conical, and even if it is not, because it is normally so short, the overall power response performance is unlikely to be significantly changed anyway.
At this stage and after giving it much consideration, I think it is probably better to leave things as they are.
Sorry - there is no simple way of getting a 'fifth-segment' option in Hornresp, if that is what you were really looking for
.Kind regards,
David

But if I understand the way the tool works the simulation is that of a current source because it has no notion of nominal impedance and there for cannot "set" a voltage.
Hi NEO Dan,
With Xmax set to a large value so that the Maximum SPL result is not displacement-limited at any frequency, the simulation will be that of a constant power source, not a constant current source. Try using the Sample tool with the Maximum SPL chart, to see how the voltage, power and displacement can vary at different frequencies.
The normal SPL response is generated using a constant voltage source Eg (assuming Rg = 0).
Kind regards,
David
Neo Dan,
It isn't too hard.
Here is an example:
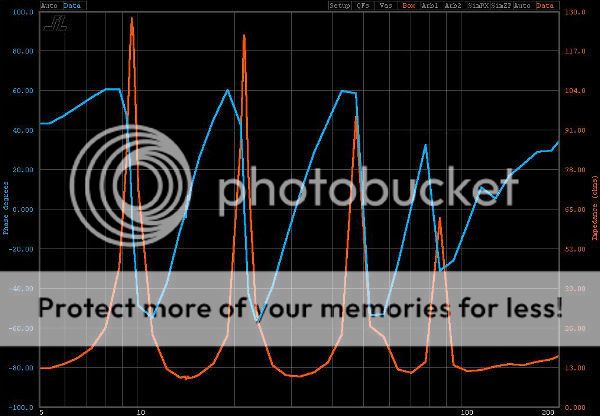
You run a Maximum SPL on a DTS-10 with 1000w, and 15mm. Double click it, enter the frequency of the lowest red point in the passband, and you get 26.418v, at ~26 watts.
Then run through the wizard, and add voltage while looking at the displacement, and it will be the same. You can just enter the voltage into the box once you learn to trust it. If you Sample a couple different frequencies on this graph though, you will find you are still at ~26w at 19Hz still, but 305w at 35Hz.
These are the two graphs you get.
Does that make more sense?
To add to what McBean said, you would use a really high xmax to get a constant wattage source. Like 1000w and 99.9mm xmax (HR limit.)
It will look similar to the impedance curve if enough power and xmax is added.
It isn't too hard.
Here is an example:
You run a Maximum SPL on a DTS-10 with 1000w, and 15mm. Double click it, enter the frequency of the lowest red point in the passband, and you get 26.418v, at ~26 watts.
Then run through the wizard, and add voltage while looking at the displacement, and it will be the same. You can just enter the voltage into the box once you learn to trust it.
If you Sample a couple different frequencies on this graph though, you will find you are still at ~26w at 19Hz still, but 305w at 35Hz.These are the two graphs you get.
Does that make more sense?
To add to what McBean said, you would use a really high xmax to get a constant wattage source. Like 1000w and 99.9mm xmax (HR limit.)
It will look similar to the impedance curve if enough power and xmax is added.
Last edited:
 I fully understand how it works, and I don't like how you are using it:
Link
An externally hosted image should be here but it was not working when we last tested it.
Way to take an unquailfied dump on the DTS-10 bro, are you proud? This is earth, we don't generally power speakers with constant wattage sources.
I can't belive you did that. Thanks for proving my point...
This tool should be voltage driven instead of power.
So using it in a direct comparison to another Hornresp Maximum SPL graph at 1000w is somehow a problem?
See: http://www.avsforum.com/avs-vb/showthread.php?p=19983190#post19983190 and the discussion following it starting at: http://www.avsforum.com/avs-vb/showthread.php?p=19984458#post19984458 Specifically: http://www.avsforum.com/avs-vb/showthread.php?p=19986138#post19986138
I'm sorry you have issues with the tool, but that does not invalidate it. At no point do I see anyone stating that this is a straight FR graph, because it isn't.
An "unquailfied dump?"Way to take an unquailfied dump on the DTS-10 bro, are you proud? This is earth, we don't generally power speakers with constant wattage sources.
Are you sure you understand the graph?
Last edited:
The bug identified by GM has now been fixed.
Greets!
So it seems, no problems opening them with the LW now, thanks!
GM
The Maximum SPL tool is not a good tool for comparison of SPL output.
How "big" would an amp have to be to supply 1000 watts into the DTS-10?
The coils of an actual DTS-10 are in series in this graph, but watts are watts right? So again, how "big" an amp would be requred to generate the displacement limited SPL indicated in your graph???
How "big" would an amp have to be to supply 1000 watts into the DTS-10?
The coils of an actual DTS-10 are in series in this graph, but watts are watts right? So again, how "big" an amp would be requred to generate the displacement limited SPL indicated in your graph???
Last edited:
Front Loaded Tapped Horn v. Offset Tapped Horn
Hi David,
Would it be reasonably possible to provide for two different tapped horn models, similar to the current two different horn models: front loaded horn and offset horn? I have found from running quite a number of tapped horn models that many models do benefit from minimizing L12, ideally the driver would energize the horn at S1 instead of S2, you might call this the front loaded tapped horn, versus entering the horn path at S2 for your current offset tapped horn. In the bargain you would gain an additional section for modeling this type of tapped horn, making the program even more versatile.
Thanks also for the lastest update, have not found any bugs yet.
Regards,
Would it be possible to export the drive voltage when you export a curve made by the max SPL tool? Together with power, current and phase if possible?
Hi David_Web,
And here's me thinking that the Sample tool already provided "more than sufficient" information
.From a practical viewpoint I wonder just how useful such additional data might be - it seems that there is enough confusion out there already, when it comes to interpreting the Hornresp Maximum SPL chart
.By 'drive voltage' do you mean Eg, or the voltage at the voice-coil taking into account Rg losses? By 'phase' I assume you mean the phase difference between voltage and current?
Kind regards,
David
Last edited:
- Home
- Loudspeakers
- Subwoofers
- Hornresp