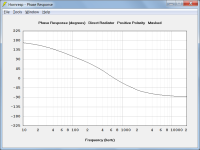
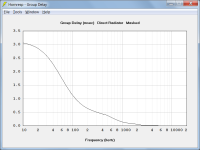
Take a look and the Phase comparison between the models X4b and X5b, they ate basically the same in the 40hz~60Hz range but the group delay is much higher for X5b.
The attached chart compares the unwrapped phase of models X4b and X5b between 40 Hz and 60 Hz, plotted on a linear scale.
The inflection points of both traces are at 50 Hz (a different frequency to where the two traces cross). The peaks in the group delay response comparison shown in Post #13,834 are at the inflection point frequency, as expected. The X5b group delay peak is higher because the phase is changing at a greater rate than for X4b, as shown in the attachment.
Yes, although technically you can determine it from the response as well.
I have done this in the past very often.
Granted, this only works for response that is without weird artifacts and bumps.
Just out of interest, what then would be the group delay for the attached response?
Attachments
The attached chart compares the unwrapped phase of models X4b and X5b between 40 Hz and 60 Hz, plotted on a linear scale.
The reason for plotting the phase using a linear rather than a logarithmic scale is so that the positions of the inflection points are correctly shown.
See the post linked below for further details:
https://www.diyaudio.com/community/...ion-with-a-2-way.334757/page-423#post-6808981
If you can remove the lowpass filter, because that would change things so drastically.Just out of interest, what then would be the group delay for the attached response?
There is no point of reference atm.
This looks like an open baffle?
With first a 6dB/oct slope followed by 12dB/oct.
In that case that really complicates things, since the Fs of both filter curves are at a different frequencies.
I was talking about just a single 2nd/3rd order system.
(would also work with higher order systems)
Although I guess you can work with curve fitting algorithms (gradient descent method or so) here to determine both slopes, Fs of all filters as well as the Q-factor eventually. From there you can calculate the GD no problem.
You can also do this manually, a result is shown here.
But because of the lowpass filter, it's kinda hard to determine and curve fit, because you don't have a reference point anymore.
In a case of just a 2nd/3rd order system (like a closed box or so), you can first determine the slope, than the Fs point, followed by determining the Q-factor. Group-delay can be calculated from there.
Attachments
The inflection points of both traces are at 50 Hz (a different frequency to where the two traces cross). The peaks in the group delay response comparison shown in Post #13,834 are at the inflection point frequency, as expected. The X5b group delay peak is higher because the phase is changing at a greater rate than for X4b, as shown in the attachment.
Thanks a lot David, That make things clear to me.
have a good day.
Best regards
marcelo
I am finally designing the multicell horn we discussed some weeks ago.The above process can be used when the horn has an exponential flare. In other cases it may be necessary to construct the cell profile using the total areas at given points along the axis, divided by the number of cells.
With an exponential profile, if the throat area, mouth area and length of a single cell are entered, then the flare cutoff frequency of that cell will be the same as for the total system. This is not necessarily the case for other profiles.
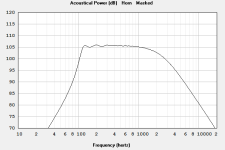
Objective: 15 cell exponential multicell horn, with good linear power response from 200 to 1k, cut off at about 100Hz, about 140cm long, based on previously designed exponential horn with similar figures.
So I approached this variation by designing three elements which I have been evalutating in horn resp, before being joined into a single horn.
The first part of the horn has an exponential flare since it is derived from the previously designed exponential horn which had an F12 of 93 Hz and a total lenght of 140cm.
This horn was "cut" at 62 cm where it will be joined with the multicell horn. The reason why it was cut exactly at 62cm is because the surface at that lenght is perfect (dimensional) match to the throat surface of the multicell (15 cells). Think of this part of the horn like a 62 cm long adapter so let's call this "adapter".
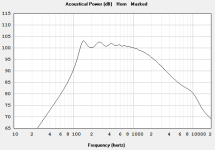
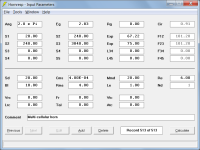
Based on Bjorn and David suggestions of some weeks ago, I modeled the single cells so they have an exponential flare and a cut off (F12) low enough for the purpose, I came up with F12 115 Hz, a lenght of 75cm, S1=16 (4x4cm), F2=256 (16x16). Let's call this "single cell".
When I multiply the throat and mouth dimensions of the single cell X 15 i get a total throat surface of 16x15=240cm and a mouth surface of 256x15=3840.
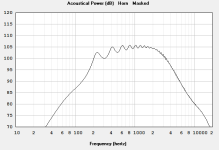
So I have designed an exponential horn with those data S1 240, S2 3840, 75cm long which represents the multicell array to be joined to the first part of the horn (the adapter). As expected the F12 value is the same as the single cells (115 Hz) but the power response is of course different, Lets call this "array"
I have then joined the "adapter" and the "array" into a two segment horn where both segments are exponential but different shape.
The first segment (adapter) has an F12 of 85Hz, the second part (array) has an F23 of 115Hz.
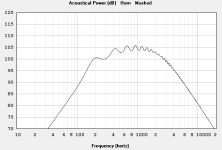
The power response of the "assembled" horn is good for the intended purpose (a multicell horn with a cut off of about 100 Hz which is usable from about to 200 to 1k).
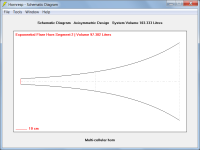
However I am not sure if this procedure is correct, also because the actual shape of the array appears to be different when I draw it in CAD vs the Hornresp data preview, if such preview is dimensionally reliable (which I have some doubts since the 10cm scale, in the preview picture is not proportioned to the size of the previewed horn.
Last edited:
David or Gumbo, you mentioned above that your multi-cell horn would have a lower cutoff of about 100 or so. I have a couple of questions for you:
First, because directionality is lost below about 80Hz, or put another way, because we sense directionality or source of sound beginning at about 80Hz, many I speak to have a rule to limit their subs to below 80Hz, and their MidBass or Mids to begin at 80Hz. Might it be possible to take your horn down to 80Hz so we don't have to plug the gap with a single driver just to carry the 80-160 octave? or the 80-250 band?
And secondly, there are lots of us that like the clarity or transparency of AMT Planars, and there are a 3-4 popular models that go down to 150Hz, but they tend to be of lower sensitivity, about 91dB, while bass horns are regularly in the 97+ range. So, just in case, might it be possible to keep in mind AMT-Planars by including a throat option that would enable a 4.5" wide by 9" high (the size several of the AMTs are) so they could be attached to the horn?
Admittedly, these are two different issues, but it would sure be nice to address the problem. Thanks for considering.
Last edited:
There's people with MUCH more knowledge then me in here but I'll try to answer your question to the best of my knowledge.
First problem, in order to have a usable low frequency of 80 Hz the horn would have to be designed with a cutoff frequency of about 40Hz (one octave lower). That IMHO would put it into full bass horn territory which requires rather different approach/design.
Second, although there are certainly some drivers with a linear response in the intended range, they are probably bigger then the 5" driver which these horns where modeled upon and this would pose some problems with the throat surface (due to the compression ratio), and will probably require some kind of phase plug. Furthermore a range from 80 to 1k is about 4 octaves which is too broad considering the ideal range of 2 octaves.
More in general, while it is true that directionality exists until the frequency you mentioned, it is rather limited at such low frequencies, so I believe it is more important keeping the critical 200 - 1k (or 300 - 1500) range assigned to the same loudspeaker which is the primary goal of the horn I am designing.
I would not worry about directionality below, which is probably very well managed by the loudspeakers assigned to those frequencies, which in my case are direct radiation 18" woofers, with a 20hz fs in 35Hz tuned 250 liters ported box.
With regards to the possibility to horn load planar loudspeakers, I don't know much about planars, but I am not sure this would yeld good results. Let's see if more users users chime in on the subject.
If you can remove the lowpass filter, because that would change things so drastically.
There is no point of reference atm.
This looks like an open baffle?
The data posted was for a driver having a constant input voltage and radiating into half space, mounted in a closed-box enclosure. No filtering was applied.
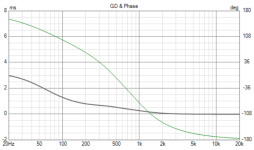
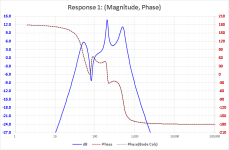
Not sure the extent of your interest, but as you know group delay is calculated from phase, and for a minimum phase system there is one and only one phase response that is associated with(and can be calculated from) any given amplitude response. The caveat is that for perfect calculation of phase from amplitude you need to know the amplitude response for at least 8-10 octaves above and below the frequency you are calculating the phase at. Fortunately most electronics and loudspeakers have relatively well defined HF and LF roll-off slopes. The method of calculation was first described by Bode back in the 40s:Just out of interest, what then would be the group delay for the attached response?

For the example you posted, both the HF and LF tails slope off at +/-12dB/oct so the derivatives of the response are constant below 10Hz and above 20kHz. This allows performing the calculation with a fair degree of accuracy Here is what I get with the tails defined as shown:


For comparison, suppose instead of sloping tails, we held last value above and below your defined response. You can see the calculated phase starts to diverge as you move away from the center toward the bad extrapolations.


It may also be of interest that VituixCAD includes this method of minimum phase "extraction" as a calculation tool
diyAudio member CharlieLaub also developed a spreadsheet that included this method of minimum phase calculation.
https://www.diyaudio.com/community/...d-minphase-extractor-tool.214713/post-3064074
http://audio.claub.net/software/FRD_Blender/Blender.html
https://techtalk.parts-express.com/...he-hilbert-transform-or-the-dft-fft#post51349
https://techtalk.parts-express.com/...one-explain-the-hilbert-transform#post1380982
Attachments
I have then joined the "adapter" and the "array" into a two segment horn where both segments are exponential but different shape.
The first segment (adapter) has an F12 of 85Hz, the second part (array) has an F23 of 115Hz.
Why not match the two cutoff frequencies exactly?
Using the multi-cellular horn design as the reference starting point:
S2 = 4 * 4 * 15 = 240 cm^2
S3 = 16 * 16 * 15 = 3840 cm^2
L23 = 75 cm
Gives F23 = 101.20 Hz
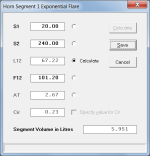
To design the adaptor, use the Horn Segment Wizard to calculate L12:
For the purposes of the exercise assume S1 = 20 cm^2
(Use the actual required throat area in your calculations)
S2 = 240 cm ^2
F12 = 101.20 Hz
Gives L12 = 67.22 cm
(For this exercise only, assuming S1 = 20 cm^2)
However I am not sure if this procedure is correct, also because the actual shape of the array appears to be different when I draw it in CAD vs the Hornresp data preview, if such preview is dimensionally reliable (which I have some doubts since the 10cm scale, in the preview picture is not proportioned to the size of the previewed horn.
I think you will find that the Hornresp scaling is exactly correct
") .
.The axial length of the horn is 75 + 67.22 = 142.22 cm or 14.222 times the length of the red 10 cm line shown on the schematic diagram. You can manually check this for yourself.
Attachments
Last edited:
For the example you posted, both the HF and LF tails slope off at +/-12dB/oct so the derivatives of the response are constant below 10Hz and above 20kHz. This allows performing the calculation with a fair degree of accuracy Here is what I get with the tails defined as shown:
Hi bolserst,
Many thanks for your post - I learn something new every day!
Just for the record, the phase and group delay results calculated by Hornresp for the posted example, are attached.
Kind regards,
David
Attachments
Last edited:
That was basically what I meantNot sure the extent of your interest, but as you know group delay is calculated from phase, and for a minimum phase system there is one and only one phase response that is associated with(and can be calculated from) any given amplitude response. The caveat is that for perfect calculation of phase from amplitude you need to know the amplitude response for at least 8-10 octaves above and below the frequency you are calculating the phase at. Fortunately most electronics and loudspeakers have relatively well defined HF and LF roll-off slopes. The method of calculation was first described by Bode back in the 40s:
View attachment 1205495
For the example you posted, both the HF and LF tails slope off at +/-12dB/oct so the derivatives of the response are constant below 10Hz and above 20kHz. This allows performing the calculation with a fair degree of accuracy Here is what I get with the tails defined as shown:
View attachment 1205499 View attachment 1205500
For comparison, suppose instead of sloping tails, we held last value above and below your defined response. You can see the calculated phase starts to diverge as you move away from the center toward the bad extrapolations.
View attachment 1205501 View attachment 1205502
It may also be of interest that VituixCAD includes this method of minimum phase "extraction" as a calculation tool
diyAudio member CharlieLaub also developed a spreadsheet that included this method of minimum phase calculation.
https://www.diyaudio.com/community/...d-minphase-extractor-tool.214713/post-3064074
http://audio.claub.net/software/FRD_Blender/Blender.html
https://techtalk.parts-express.com/...he-hilbert-transform-or-the-dft-fft#post51349
https://techtalk.parts-express.com/...one-explain-the-hilbert-transform#post1380982
Totally forgot about the name Hilbert transform. It's been ages that I actively worked with those. (back at the control theory courses)
If I remember well, these still don't work super well with very erratic frequency responses?
Last edited:
I guess that's the Le we're looking at.The data posted was for a driver having a constant input voltage and radiating into half space, mounted in a closed-box enclosure. No filtering was applied.
I personally always design without Le first. Reason being that it sometimes can give a bit of a skewed impression about what's possible from a system design perspective.
It also makes it sometimes very difficult to compare different speakers.
In this case it gave a bit of a false impression of what was really going on because of that 6dB/oct (kinda) initial slope.
After I am satisfied with a certain design, I will add the Le to see if it messes anything up.
I guess that's the Le we're looking at.
The Le value used was 1.00 mH.
Yup, but it's an iterative tool (you need to adjust a slider to achieve a target Fb)
It's a small price to pay surely, to get accurate Fb predictions (including when Lrc is very long) and not calculate negative values for Lpt
.Using the latest equation:
Fb = 60 Hz
Vb = 100 litres
Lrc = 30 cm
Ap = 80 cm^2
Lpt = -0.70 cm
As long as it is a minimum phase process, and has well defined HF and LF slopes it will work well.If I remember well, these still don't work super well with very erratic frequency responses?
Do you have an example you think might be troublesome?
Here is sample with several closely spaced peaks and nulls, and you can see the phase calculated from the amplitude response matches well.
Attachments
- Home
- Loudspeakers
- Subwoofers
- Hornresp