There are differences:
Conical horn is first:
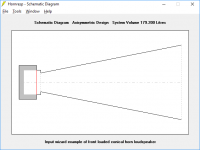
Shape of the horn.
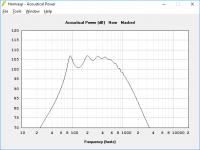
Frequency response.
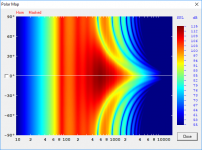
Polar pattern.
Hypex horn:
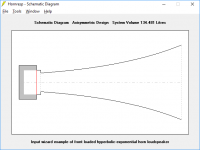
Shape.
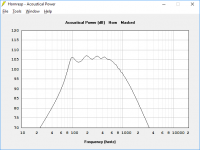
Frequency response.
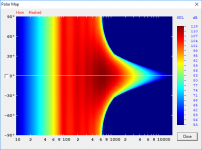
Polar pattern.
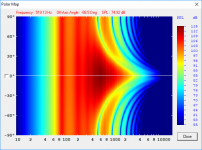
If you generate the polar pattern in Hornresp you will see that at the areas where there is a severe null. Over 20 db actually. And these nulls are at octave intervals. The first one from the left is at 519 hertz and next one is at 1049 hertz. You can't EQ these out effectively.
And there are some simple facts in music. The greatest amount of musical information is below 1000 hertz. The rest is of our hearing range is useful and required to generate spatial information about where objects are. And there is the required harmonics information above this frequency area. But the business of making music resides mostly below one kilohertz.
Those nulls are the biggest reason why a conic is not that great compared to other horn shapes.
Within hornresp one does not see a compelling reason to NOT use the conical flare in the 90 to 500 Hz range. All of the "windows" look about the same for both hypex and conical. Of course, I know there is more magic involved in making a good horn than getting a nice response curve with hornresp. But it does point you in the right direction!
Conical horn is first:

Shape of the horn.

Frequency response.

Polar pattern.
Hypex horn:

Shape.

Frequency response.

Polar pattern.

If you generate the polar pattern in Hornresp you will see that at the areas where there is a severe null. Over 20 db actually. And these nulls are at octave intervals. The first one from the left is at 519 hertz and next one is at 1049 hertz. You can't EQ these out effectively.
And there are some simple facts in music. The greatest amount of musical information is below 1000 hertz. The rest is of our hearing range is useful and required to generate spatial information about where objects are. And there is the required harmonics information above this frequency area. But the business of making music resides mostly below one kilohertz.
Those nulls are the biggest reason why a conic is not that great compared to other horn shapes.
Does a stepped conical to approximate hyp also have null issues?
Less.
Sometimes none. It depends on the number of steps and their location in the horn path length.
I have to point out that I took the test file included in Hornresp, pressed the Help button and auto generated a conical and hypex horn from the original data. It could have been optimized a bit more either way. But the nulls are always present in a straight conical horn.
To see the fancy colour chart you can go from the Acoustical Power page press tools, directivity, polar map. The map starts to make sense when you study it a bit. And you can move your cursor over the chart and see the spl response. On the right hand side there is a vertical colour versus SPL chart that shows what the colours mean. Blue is the lowest SPL red is the highest.
Hi yall, does anyone know how to simulate a Wbin front loaded horn in hornresp? Its for an EV eliminator 1a cabinets
http://www.cyborgs.de/synthesizer/projekte/elli/ELI_Box2.jpg
I dont know how to plot it when hornresp only allows for 1 horn simulation... Thanks everyone
http://www.cyborgs.de/synthesizer/projekte/elli/ELI_Box2.jpg
I dont know how to plot it when hornresp only allows for 1 horn simulation... Thanks everyone
Hi yall, does anyone know how to simulate a Wbin front loaded horn in hornresp? Its for an EV eliminator 1a cabinets
http://www.cyborgs.de/synthesizer/projekte/elli/ELI_Box2.jpg
I dont know how to plot it when hornresp only allows for 1 horn simulation... Thanks everyone
Hi guilldea,
The "Wbin" is a bifurcated horn (a horn divided into two branches). Simply double the cross-sectional areas of one half of the horn to find the total cross-sectional areas for the complete horn system. (The Klipschorn bass corner horn is another well-known example of a bifurcated horn design).
Kind regards,
David
I've seen no plots of the phase response across the band. That's where I'd expect to see some significant differences.Within hornresp one does not see a compelling reason to NOT use the conical flare in the 90 to 500 Hz range. All of the "windows" look about the same for both hypex and conical.
Simply double the cross-sectional areas of one half of the horn to find the total cross-sectional areas for the complete horn system.
Hi David, thanks a bunch.
I´ve seen this suggested elsewhere but was doubtful because the cross-sectional area is related to the impedance of the soundwave in that point and that to the efficiency of the energy transfer, and didnt know if simply by adding the areas Id get an accurate response, but if you think so Im good.
Another question I have is how should I go about "unfolding" the horn, just meassuring each L as the "center line" or "advanced center line" lengths and setting them to "Par"?
Much appreciated
how should I go about "unfolding" the horn
Hi guilldea,
Just as you have described.
The difference in response using the "advanced centre line" method rather than the more straight-forward "centre line" method is unlikely to be significant over the (bass) frequency range of interest.
Kind regards,
David
Hi guilldea,
Just as you have described.
The difference in response using the "advanced centre line" method rather than the more straight-forward "centre line" method is unlikely to be significant over the (bass) frequency range of interest.
Kind regards,
David
Depends on the number of folds and what you term "significant"
That's significant to me
Depends on the number of folds and what you term "significant". My first build that was done using the centerline rather than the advanced centerline method resulted in a resonance frequency that was 5% higher than predicted.
That's significant to me.
Hi Brian,
Would it be possible to post screenprints of the Hornresp Input Parameters windows for your two simulations - the first using the standard centre line approach and the second using your advanced centre line method? Also, what was the value of the measured resonance frequency? Many thanks.
Best Wishes for Christmas and the New Year (and to everyone else who reads this post).
Kind regards,
David
Hi David, it was my POC #2 project, documented here - The Subwoofer DIY Page v1.1 - Projects : "Proof of Concept #2"
I'll have a look for the spreadsheet that I used to work out the path length using the centerline method, though I suspect that I no longer have it.
I have found that using the advance centreline method - it is possible to unfold a horn and create an unfolded path that has an area / volume within a couple of percent of the original horn.
It is possible to then use this data to create a sim that has a path length and a volume close to what is realistic.
The biggest challenge is simplifying the unfolded layout to a few segments that can be simulated in Hornresp.
The worst excesses are sims that have a volume which is bigger than the outside dimensions of the box. These sims seem to show a great advantage in performance but often don’t stand up to close scrutiny.
Minimizing errors at every stage helps to ensure that the overall results are closer to reality as any errors introduced are accumulative.
Practical implementation of these techniques help to get results that are right first time - which is important to the DIY'er who often will not have the time and resouces to make endless potototypes.
I have found that using the advance centreline method - it is possible to unfold a horn and create an unfolded path that has an area / volume within a couple of percent of the original horn.
It is possible to then use this data to create a sim that has a path length and a volume close to what is realistic.
The biggest challenge is simplifying the unfolded layout to a few segments that can be simulated in Hornresp.
The worst excesses are sims that have a volume which is bigger than the outside dimensions of the box. These sims seem to show a great advantage in performance but often don’t stand up to close scrutiny.
Minimizing errors at every stage helps to ensure that the overall results are closer to reality as any errors introduced are accumulative.
Practical implementation of these techniques help to get results that are right first time - which is important to the DIY'er who often will not have the time and resouces to make endless potototypes.

Hi David, it was my POC #2 project, documented here - The Subwoofer DIY Page v1.1 - Projects : "Proof of Concept #2"
I'll have a look for the spreadsheet that I used to work out the path length using the centerline method, though I suspect that I no longer have it.
Thanks Brian!
Because the bends in your POC #2 design are relatively wide, the difference in L23 calculated using the standard and advanced centreline methods is likely to be quite large. It makes good sense to use the advanced method in this case.
Kind regards,
David
I have found that using the advance centreline method - it is possible to unfold a horn and create an unfolded path that has an area / volume within a couple of percent of the original horn.
Hi Xoc1,
Thanks for the feedback. It seems that the advanced centreline method is the way to go
Kind regards,
David
- Home
- Loudspeakers
- Subwoofers
- Hornresp