me, too; though I'm often frustrated that the directivity tool only works for single segment horns
That's because calculating directivity is not a trivial task
Acoustical power is a well-defined term, so it should be used only in that well-defined way.
Hi Uli,
I changed the chart name from Constant Directivity to Acoustical Power to distinguish between the "Acoustical Power" chart, which shows the pressure response of a loudspeaker radiating uniformly into a specified solid angle, and the "Acoustical Pressure" chart, which takes the directivity characteristics of the loudspeaker into account. Both charts in fact show sound pressure levels.
I would prefer not to have to change the chart name from "Acoustical Power" back to "Constant Directivity" or perhaps alternatively "Uniform Directivity", even though technically they would be more correct descriptions.
When I changed from "Constant Directivity" to "Acoustical Power" I realised that the term might be misleading and/or confusing to some users, which is why I went to considerable lengths in the Hornresp Help file to explain exactly what the chart represents.
Given that the information presented in the Acoustical Power chart can be useful, particularly at lower frequencies, do you have any suggestions for a more appropriate two-word title that I could perhaps use to describe the chart? Suggestions / comments from other users would also be appreciated.
Kind regards,
David
That's because calculating directivity is not a trivial task. Analysing multiple segment horns really requires the use of a true finite-element model, which in the case of Hornresp would complicate things greatly and significantly slow down the calculation of results. I experimented with a boundary element model some time ago, but it just took too long (several hours) to generate the desired frequency response curve, so the project was abandoned.
I thought that was the case and appreciate the explanation. Perhaps some day our computers will be powerful enough to do these calculations in near real time. Personally I wouldn't mind in the least if I had to let a calculation run overnight. I actually started down the path of learning ABEC but got distracted and never got back to it.
Hi nc535, David and mwmkravchenko,
regarding acoustic power, i would only name a plot like that, if it plotted acoustic power. And if i could supply that plot, i would, because acoustic power is a concept simple to grasp and important. Whereas, what Hornresp shows now as "acoustical power", is not acoustic power. "Acoustic power" of Hornresp is obeying to certain rules, but those rules are too special for me -- i cannot easily relate such a plot to the world, which i know. I like acoustic power and SPL.
Yours, Uli
Whereas, what Hornresp shows now as "acoustical power", is not acoustic power.
Hi Uli,
The classic authoritative reference textbook "Acoustics" by Leo Beranek, states on page 14 that the Acoustic Power Level (PWL) of a sound source, in decibels, is 10 times the logarithm to the base 10 of the ratio of the acoustic power radiated by the source to a reference acoustic power.
That is,
PWL = 10 * Log10(W / Wref) dB
In Hornresp, Wref = Ang * pref ^ 2 / (rho * c) watts
The value for Wref is deliberately chosen to make the acoustical power level equal to the 1 metre sound pressure level.
For radiation into half space, Ang = 2 * Pi steradians.
As mentioned earlier:
pref = 2 * 10 ^ -5 pascals
rho = 1.205 kilograms per cubic metre
c = 344 metres per second
Therefore:
Wref = 2 * Pi * (2 * 10 ^ - 5) ^ 2 / (1.205 * 344) = 6.06 * 10 ^ -12 watts or 6.06 picowatts, for half-space radiation
The Hornresp Acoustical Power chart plots PWL versus frequency, which is also equivalent to constant directivity SPL versus frequency, because of the value chosen for the normalising reference acoustical power Wref.
"Acoustical Power" is therefore considered to be an appropriate title to use for the chart in question, because it plots the acoustic power level, as defined by Beranek.
This has been an interesting discussion, thanks for raising the issue
Kind regards,
David
Picking at minute details is not going to help you or anyone else design loudspeakers.
Perhaps not, but please continue to do so
As I have said on previous occasions, I want Hornresp to be as good as it can be, minute details included.
A recent example is the work done on the Wavefront Simulator tool.
The standard reference level for PWL (or Lw) is 1pW, and SPL can be found simply as
Lp = Lw + 10*log(1/Ang),
which for 1W gives 120 + 10*log(1/2Pi) = 112.02dB SPL.
So is the question really about scaling the values so that the dB value corresponds to the power referenced to 1pW? Because the shape of the curve is correct for PWL. And as David points out, IS the power level, for a certain reference power.
Uli, are you in a standards committee by any chance? Those people tend to be quite picky about such things as this (I have a colleague at the Uni who has worked on acoustic standards, and it's quite easy to get him into rant mode about some slight incorrect use of a term or definition.)
If the only thing that is required to make you happy is to refer the PWL curve to 1pW instead of the reference level David uses, I guess that could easily be accomplished. But I think it would be much more confusing to the average user, who is not familiar with acoustic power level. Especially since the level of the curve would now be higher (120dB instead of 112dB for 1W into 2Pi), and would not change as ANG changed. Perhaps the sample tool could provide the power level value?
I guess the proper name for the curve currently displayed is "Acoustic power level equivalent SPL", but it's a bit long as a chart title... "Power Response" is an alternative, since it gives no reference to level.
Lp = Lw + 10*log(1/Ang),
which for 1W gives 120 + 10*log(1/2Pi) = 112.02dB SPL.
So is the question really about scaling the values so that the dB value corresponds to the power referenced to 1pW? Because the shape of the curve is correct for PWL. And as David points out, IS the power level, for a certain reference power.
Uli, are you in a standards committee by any chance? Those people tend to be quite picky about such things as this
If the only thing that is required to make you happy is to refer the PWL curve to 1pW instead of the reference level David uses, I guess that could easily be accomplished. But I think it would be much more confusing to the average user, who is not familiar with acoustic power level. Especially since the level of the curve would now be higher (120dB instead of 112dB for 1W into 2Pi), and would not change as ANG changed. Perhaps the sample tool could provide the power level value?
I guess the proper name for the curve currently displayed is "Acoustic power level equivalent SPL", but it's a bit long as a chart title... "Power Response" is an alternative, since it gives no reference to level.
Hi Kolbrek and David,
At this time Hornresp does not plot acoustical power, because an important property of acoustical power is, that it has only one reference, which is a certain alternating power, just as SPL has only one reference, which is a certain alternating pressure. Whereas of now, "acoustical power" of Hornresp has two references, at first a certain power, and at second a certain radiation angle limit (full-space, half-space and so on).
Yours, Uli
At this time Hornresp does not plot acoustical power, because an important property of acoustical power is, that it has only one reference, which is a certain alternating power, just as SPL has only one reference, which is a certain alternating pressure. Whereas of now, "acoustical power" of Hornresp has two references, at first a certain power, and at second a certain radiation angle limit (full-space, half-space and so on).
Acoustic power is different from SPL, hence values will likely differ. The average user shall either understand that or limit his studies to one of both, so he does not get confused. Acoustic power is not SPL.If the only thing that is required to make you happy is to refer the PWL curve to 1pW instead of the reference level David uses, I guess that could easily be accomplished. But I think it would be much more confusing to the average user, who is not familiar with acoustic power level. Especially since the level of the curve would now be higher (120dB instead of 112dB for 1W into 2Pi), and would not change as ANG changed. Perhaps the sample tool could provide the power level value?
Yours, Uli
The standard reference level for PWL (or Lw) is 1pW
Hi Bjørn,
It is interesting that in his original 1954 book Beranek uses 10 ^ -13 watt for Wref, giving a power level of 130 dB for 1 acoustic watt radiated, whereas in the recent Beranek and Mellow updated book it is stated that "in most countries, Wref is 1 pW". Could this perhaps mean that there is still no universally-accepted standard value for Wref?
Kind regards,
David
At this time Hornresp does not plot acoustical power, because an important property of acoustical power is, that it has only one reference, which is a certain alternating power, just as SPL has only one reference, which is a certain alternating pressure. Whereas of now, "acoustical power" of Hornresp has two references, at first a certain power, and at second a certain radiation angle limit (full-space, half-space and so on).
Hi Uli,
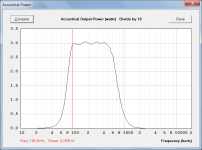
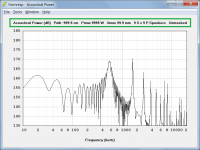
Attachment 1 shows the actual acoustical power output for the default record with resonances masked. Do you see this chart as being useful?
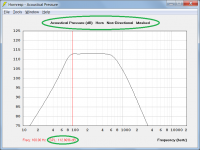
Attachment 2 shows the current "Acoustical Power" chart renamed as "Acoustical Pressure" but with the words "Non-Directional" also included in the title. Do you see this as being an acceptable alternative caption to use?
Note that non-directional refers to the characteristics of the unconstrained radiating source only. The actual output will of course be directional to the extent that it is confined to the solid angle specified by the Ang input parameter. The output is only truly non-directional or omnidirectional when radiating into 4 Pi space. Hopefully the user would understand this.
Kind regards,
David
Attachments
Last edited:
Could this perhaps mean that there is still no universally-accepted standard value for Wref?
It could also mean that the standard has changed. I would need to check the ISO standards to check.
Hi Uli,
Please be clear if you are talking about acoustical power in watts, or acoustical power level in dB re 1pW. They are not the same, although they are descriptions of the same physical quantity. Power level is relative, and has a reference. Power in watts is an absolute unit, derived from fundamental SI units. When complaining that others are using a sloppy terminology, you should be careful to get things correct yourself
The values will differ, as I pointed out above, by a constant factor, between acoustical power level and SPL for an omnidirectional source. This would be a correction factor applied to go from David's Wref to the 1pW Wref. The shape of the curve will not change, because the curve is based on the radiated power.
How is acoustical power useful to the average user? It is a well defined quantity, but it's not something you can measure with equipment avaliable to most people. Intensity probes or reverberation chambers are not usually available to the average Hornresp user, and integrating sound pressure over a sphere around the speaker in a reflection-free environment isn't exactly simple either.
Previously you stated:
If you look in the helpfile of Hornresp (if you had done that before aksing the first question, you wouldn't have had to ask about what to do with a beaming horn), you will see how the Acoustical Power chart is computed:
It would be helpful if you could come up with a suggestion of how this sloppy use of terminology could be fixed. You are repeatingly saying that this and that is wrong, but give no suggestions on how it should be fixed to satisfaction. So please tell us, should David
1) plot the acoustical power in watts on a linear scale, as above, or
2) plot the acoustical power level in dB re 1pW, or
3) rename the chart to:
5) something else? Then what?
The Acoustical Power chart shows the power response, the frequency response of the total power radiated by the loudspeaker, and that is a useful quantity. We need both that curve and the curve including the directivity.
At this time Hornresp does not plot acoustical power, because an important property of acoustical power is, that it has only one reference, which is a certain alternating power, just as SPL has only one reference, which is a certain alternating pressure.
Please be clear if you are talking about acoustical power in watts, or acoustical power level in dB re 1pW. They are not the same, although they are descriptions of the same physical quantity. Power level is relative, and has a reference. Power in watts is an absolute unit, derived from fundamental SI units. When complaining that others are using a sloppy terminology, you should be careful to get things correct yourself
Acoustic power is different from SPL, hence values will likely differ. The average user shall either understand that or limit his studies to one of both, so he does not get confused. Acoustic power is not SPL.
The values will differ, as I pointed out above, by a constant factor, between acoustical power level and SPL for an omnidirectional source. This would be a correction factor applied to go from David's Wref to the 1pW Wref. The shape of the curve will not change, because the curve is based on the radiated power.
How is acoustical power useful to the average user? It is a well defined quantity, but it's not something you can measure with equipment avaliable to most people. Intensity probes or reverberation chambers are not usually available to the average Hornresp user, and integrating sound pressure over a sphere around the speaker in a reflection-free environment isn't exactly simple either.
Previously you stated:
Acoustical power is a well-defined term, so it should be used only in that well-defined way. For a start, it is stated in Watts, not in Pascals. Acoustical intensity in W/m^2 can become translated into SPL in Pa without special presumptions (just speed of sound in air and density of air, which are constant at sea level), but power cannot become translated into SPL without special presumptions, as this translation also depends on distance and radiation pattern.
If you look in the helpfile of Hornresp (if you had done that before aksing the first question, you wouldn't have had to ask about what to do with a beaming horn), you will see how the Acoustical Power chart is computed:
|Acoustical Power
~~~~~~~~~~~~~~~~~
Constant directivity sound pressure produced at a point source normalised distance of one metre when the driver is supplied with a signal of a given voltage, versus frequency in hertz. The level is expressed in decibels relative to the standard reference sound pressure of 20 micropascals.
The Directivity Response tool can be used to take into account the frequency dependent directional characteristics of direct radiating single drivers and finite single-segment horns.
It would be helpful if you could come up with a suggestion of how this sloppy use of terminology could be fixed. You are repeatingly saying that this and that is wrong, but give no suggestions on how it should be fixed to satisfaction. So please tell us, should David
1) plot the acoustical power in watts on a linear scale, as above, or
2) plot the acoustical power level in dB re 1pW, or
3) rename the chart to:
a) Acoustical pressure (non-directional), or
b) Acoustical power equivalent SPL, or
c) Power response, or
d) something else? or
4) leave it as it is, orb) Acoustical power equivalent SPL, or
c) Power response, or
d) something else? or
5) something else? Then what?
The Acoustical Power chart shows the power response, the frequency response of the total power radiated by the loudspeaker, and that is a useful quantity. We need both that curve and the curve including the directivity.
Kobrek, thou are right, any real number can become expressed either as absolute or as a logarithm times a reference. David, the latter is better for us, if the reference is also stated on the plot sheet. I would replace "Non-Directional Acoustical Pressure" by acoustic power.
It could also mean that the standard has changed. I would need to check the ISO standards to check.
Hi Bjørn,
Thanks to a reader of this thread, I have just learned that American National Standard Acoustical Terminology S1.1-1994 (ASA Catalog No. 111-1994) states the following:
"4.07 sound power level. Ten times the logarithm to the base ten of the ratio of a given sound power in a stated frequency band, to the reference power of one picowatt (1pW). Unit, decibel (dB); abbreviation PWL; symbols, Lp or Lw."
It would seem that 1pW is the current standard in the United States at least.
Kind regards,
David
Kobrek, thou are right, any real number can become expressed either as absolute or as a logarithm times a reference. David, the latter is better for us, if the reference is also stated on the plot sheet. I would replace "Non-Directional Acoustical Pressure" by acoustic power.
Hi Uli,
If I understand correctly:
1. There is no need for an "actual acoustical power output" chart to be included in Hornresp (particularly as the output power value can already be checked at any frequency using the Sample tool).
2. The "Acoustical Power" chart title can be retained provided that the reference power level is stated on the chart.
Because it now seems likely that 1pW is the generally-accepted standard reference power level, using anything other than that value for Wref tends to weaken the argument that the chart is showing acoustical power level, as normally defined.
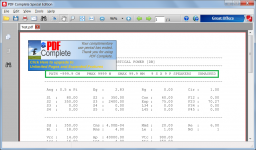
Also, including the reference power level in the chart title would unfortunately exceed the available width when printing out a hard copy of the chart. The attachments show the current "worst case" title, which just fits when printed out. The previously-proposed inclusion of "Non-Directional" in a title changed to read "Acoustical Pressure", would suffer from the same problem. The hard copy title is limited to a width of 80 characters, including embedded spaces.
It would seem that realistically we are now left with only two options:
1. Retain the "Acoustical Power" title but include in the Help file details of how the customised value of Wref used in Hornresp is calculated.
2. Rename the chart as "Acoustical Pressure", but explain in the Help file that the default chart assumes a non-directional source, and that the Directivity tool has to be used if loudspeaker directivity characteristics are to be taken into account.
Let's have a Brexit-type vote on it - do we want Hornresp to go down the path of option 1, or of option 2?
Kind regards,
David
Attachments
There is just one acoustic property, which stands for itself or has only one reference if expressed as logarithm, acoustic power. Unlike with pressure, with power it does not matter, where the recipient is. Power is as absolute as the sun king, just Watts or PWL. While it may depend on radiation angle, as a smaller radiation angle lifts up impedance and so power, it does not contain it. Power does not refer to radiation angle.
Last edited:
After carefully considering all the comments posted on "acoustical power" I have decided to leave Hornresp unchanged. I appreciate that the term might be confusing to some users, but I am prepared to live with that. The acoustical power chart section of the Help file may be amended in due course if I can think of a better description.
Thanks to Uli and Bjørn for the stimulating discussion.
Thanks to Uli and Bjørn for the stimulating discussion.
also the directivety tool can only be used in a 1 section horn
Hi epa,
The reason for this is given in Post #6381.
Kind regards,
David
Perhaps not, but please continue to do so.
As I have said on previous occasions, I want Hornresp to be as good as it can be, minute details included.
A recent example is the work done on the Wavefront Simulator tool.
Understood.
Sometimes I'm a little grumpy

- Home
- Loudspeakers
- Subwoofers
- Hornresp


