Windows 10 startup error
I just got a new Windows 10 computer (Surface Pro 4). One of the first things I tried to do was download Hornresp because you know, AWESOME! But after unzipping the download package and trying to open the application I get the same error as sine143: Run-Time Error '380', invalid property value. Have any other Windows 10 users run in to this?
just got this error, anythoughts (on startup).
I just got a new Windows 10 computer (Surface Pro 4). One of the first things I tried to do was download Hornresp because you know, AWESOME! But after unzipping the download package and trying to open the application I get the same error as sine143: Run-Time Error '380', invalid property value. Have any other Windows 10 users run in to this?
I just got a new Windows 10 computer (Surface Pro 4). One of the first things I tried to do was download Hornresp because you know, AWESOME! But after unzipping the download package and trying to open the application I get the same error as sine143: Run-Time Error '380', invalid property value. Have any other Windows 10 users run in to this?
Win10 works fine for me but the machine was previously upgraded from 7, not a fresh load.
Happen to have a new Dell i3/win 10 laptop on loan, so gave it a try and except for getting a pop-up asking if I wanted to accept this unknown source, it quickly installed it, though didn't install any quick links, so had to open it from its C drive folder.
Anyway, works fine displaying the default file as well as adding, changing, etc., several new files, though didn't take the time to load any of my old existing files, but assume these would work also based on them working over the years with changing computers, operating systems.
GM
Anyway, works fine displaying the default file as well as adding, changing, etc., several new files, though didn't take the time to load any of my old existing files, but assume these would work also based on them working over the years with changing computers, operating systems.
GM
Hornresp Update 3950-160115
Hi Everyone,
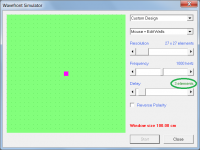
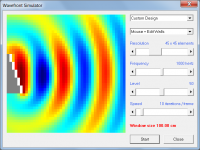
Time-delayed drivers can now be specified in the Wavefront Simulator tool. Another change to the tool is that sound pressure variations in the wavefronts are now more clearly defined. The way that a reverse-polarity driver is specified has also been changed. See the Wavefront Simulator description in the Tools Menu section of the Hornresp Help file for further details.
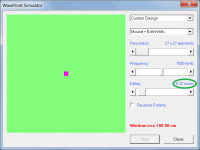
The delay slider is calibrated in the units shown in green (see attachment 1). Double-click on the delay value to show the equivalent delay in other units, shown in blue (see attachment 2).
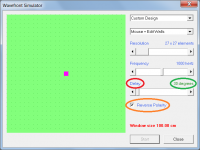
To change the calibration scale of the delay slider, double-click on the delay value to select the required units and then double-click on the 'Delay' label to set the new calibration. To specify a reverse polarity driver, click the check box (see attachment 3).
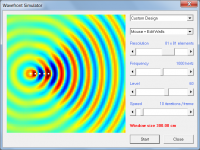
Attachment 4 shows an example of a 5-source end fire array, with sources 2 to 5 to the right of source 1, and spaced at intervals of 3 grid elements. Each source is progressively delayed by a time equivalent to a distance of 3 grid elements.
Attachment 5 shows an example of a 5-source offset "phased" array with each of the sources 2 to 5 progressively delayed by a time equivalent to a distance of 1 grid element, and physically displaced by 1 grid element to compensate, so that the resultant wavefronts remain in phase.
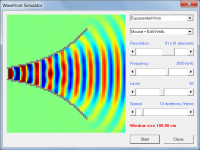
Attachment 6 shows an example of an exponential horn becoming directional at higher frequencies.
My thanks to 'Patrick Bateman' for suggesting the time-delayed drivers enhancement to the Wavefront Simulator tool.
Kind regards,
David
Hi Everyone,
Time-delayed drivers can now be specified in the Wavefront Simulator tool. Another change to the tool is that sound pressure variations in the wavefronts are now more clearly defined. The way that a reverse-polarity driver is specified has also been changed. See the Wavefront Simulator description in the Tools Menu section of the Hornresp Help file for further details.
The delay slider is calibrated in the units shown in green (see attachment 1). Double-click on the delay value to show the equivalent delay in other units, shown in blue (see attachment 2).
To change the calibration scale of the delay slider, double-click on the delay value to select the required units and then double-click on the 'Delay' label to set the new calibration. To specify a reverse polarity driver, click the check box (see attachment 3).
Attachment 4 shows an example of a 5-source end fire array, with sources 2 to 5 to the right of source 1, and spaced at intervals of 3 grid elements. Each source is progressively delayed by a time equivalent to a distance of 3 grid elements.
Attachment 5 shows an example of a 5-source offset "phased" array with each of the sources 2 to 5 progressively delayed by a time equivalent to a distance of 1 grid element, and physically displaced by 1 grid element to compensate, so that the resultant wavefronts remain in phase.
Attachment 6 shows an example of an exponential horn becoming directional at higher frequencies.
My thanks to 'Patrick Bateman' for suggesting the time-delayed drivers enhancement to the Wavefront Simulator tool.
Kind regards,
David
Attachments
I just got a new Windows 10 computer (Surface Pro 4). One of the first things I tried to do was download Hornresp because you know, AWESOME! But after unzipping the download package and trying to open the application I get the same error as sine143: Run-Time Error '380', invalid property value. Have any other Windows 10 users run in to this?
Hi tp7886,
Your error is a bit different to the one experienced by 'sine143'. In his case, run-time error 62 (input past end of file) was due to a corrupt Hornresp.dat data file, which unfortunately could not be repaired. The cause of the file corruption remains a mystery.
Your run-time error 380 (invalid property value) would seem to be due to an incompatibility between the Windows 10 operating system on your Surface Pro 4 and the Microsoft Visual Basic 6 language used to program Hornresp.
Microsoft has indicated that VB6 executable programs (such as Hornresp) should be able to run on Windows 10.
Kind regards,
David
is there a way to display the "large voice coil" sim adjustments in the acoustic power window (on the actual calculate screen?)
No - and it's not going to happen
") .
.is there a way to display the "large voice coil" sim adjustments in the acoustic power window (on the actual calculate screen?)
I don't want to speak for David but we did discuss this and I lobbied to have the large voice coil results not be confined to the Loudspeaker Wizard but it was decided to leave the results confined to the Wizard.
The reasons being that the Large Voice Coil results were empirically derived and not a perfect model, there are certain subtle issues with it. I'm not sure if you read the paper on this adjustment (I think you did) but I'll quickly go over the obvious imperfections.
First, although there is a great correlation between the derived frequency response and actual professional measurements, the derived impedance that the adjustment provides is clearly wrong. Not by a lot but still visibly wrong. This was an easy fix since the measured impedance is virtually identical to an unadjusted sim, so the Large Voice Coil results use the adjusted frequency response and unadjusted impedance. That way both frequency response and impedance match measured results very well, but it is a clue that the adjustment method is not perfect.
Second, in all cases (where measurements indicated the actual power level and sensitivity) the Large Voice Coil results were consistently about 2 db lower than the measured level. In other words, although the derived frequency response curve shape is a very good match to the measurements, the curve is a couple db low in the sim compared to the measurement. Nothing was done to correct this, so you can expect to see a bit higher sensitivity than the Large Voice Coil sims indicate.
It's also not clear whether the excursion predictions are completely accurate due to the impedance issue and I don't know of any way to verify their accuracy. There are no measurements that include excursion data. I would say the excursion data is fine (within the context of the low sensitivity issue) but I have no way to prove this.
For these reasons it was decided that the Large Voice Coil results should be confined to the Loudspeaker Wizard, since allowing it in the main section of the program would bring up questions about the validity of the extra data that the extra graphs provide.
IMO the derived results are at least as valid as the "Power Compression" feature which is accessible outside the Wizard but having the limited results within the confines of the Wizard is plenty good enough as far as I'm concerned.
Also there is a workaround to get the results into the main part of the program anyway. Simply use the formula in the paper to find the new value for Bl and manually enter it on the input screen and hit Calculate instead of using the Wizard to adjust Bl for you. This gives the same results the Wizard would provide but in the main section of the program.
I've always been the first to admit that this method is not perfect. I haven't been the last though, IIRC Bjorno called it "Layman Nonsense" or something to that effect but when prompted to show me how to achieve results anywhere near as accurate as this method provides (especially for the more complex designs like horns) he declined to respond and continues to show unadjusted sims of known Large Voice Coil drivers that are clearly wrong. There quite simply is no other way to get an accurate sim of this type of driver in a program like Hornresp. It might (or might not) be possible in other programs that include a complex inductance model, but there are very few programs that can do that and they can't simulate more complex enclosures.
Having discussed the issues allow me to quickly cover the advantages. Based on empirical curve fitting of (IIRC) 50 sims vs professional measurements of a variety of Large Coil drivers in a number of different enclosure types (sealed, ported, flh, tapped horn), a great correlation between measurement and adjusted sim was accomplished in ALL cases with a simple generic formula adjustment.
Here's a picture made by LTD02, who was a major contributor to this adjustment method. LTD adjusted for sensitivity of the derived sim response in this image but the frequency response curve shape is exactly as output by Hornresp. The adjusted sim overlays the measured response almost perfectly while the unadjusted sim isn't even close to accurate.
An externally hosted image should be here but it was not working when we last tested it.
Admittedly the results are not always this perfect, but it goes to show that there is clearly validity to this method.
Here's a link to the paper - https://sites.google.com/site/amate...coil-simulation-accuracy-issue-and-adjustment
If you want to use this feature you really should read the paper. It covers a lot of ground, how to identify drivers that will benefit from using this adjustment, how the method was developed and images of the 50 or so examples comparing sims to measurements.
This is a lot more info that you asked about and I know you know most or all of it but I just thought I'd mention it for those that haven't seen it. Also David seems to have responded quite succinctly while I was typing although as noted in bold above there is a way to do it by adjusting Bl manually in the input screen.
Last edited:
The adjusted sim overlays the measured response almost perfectly
As HornResp does not include the impact of box losses in the sim, a perfect overlay should not happen anyway, adjusted or otherwise, unless the adjustment itself includes the impact of box losses.
Maybe it should be called the "Large Voice Coil + Losses" ratch
Just thought of these last night..
Enhancement request #1: A vertical line on the Loudspeaker Wizard: Power Response chart that shows where Fb (the lowest resonance frequency) is. This would save me from having to go back and forth between the Power Response and Impedance charts when designing for a particular Fb.
Enhancement request #2: An option to display the vertical axis for the Loudspeaker Wizard: Power Response chart in 3dB (or 6dB) rather than 5dB steps.
Enhancement request #1: A vertical line on the Loudspeaker Wizard: Power Response chart that shows where Fb (the lowest resonance frequency) is. This would save me from having to go back and forth between the Power Response and Impedance charts when designing for a particular Fb
.Enhancement request #2: An option to display the vertical axis for the Loudspeaker Wizard: Power Response chart in 3dB (or 6dB) rather than 5dB steps.
Brian, you can always export all chart data to room eq wizard for better graph flexibility.
That doesn't help when you're using the other features of the Loudspeaker Wizard to massage an alignment to meet your specific requirements
As HornResp does not include the impact of box losses in the sim, a perfect overlay should not happen anyway, adjusted or otherwise, unless the adjustment itself includes the impact of box losses.
Maybe it should be called the "Large Voice Coil + Losses" ratch
While this is certainly true it isn't much of an issue.
The measurements all came from Josh Ricci, posted either on data-bass or in his forum. The test boxes were constructed by Ricci and presumably done in a sturdy fashion so as to reduce the effect of box losses as much as possible. There isn't going to be a large effect from box losses in a well constructed sealed box in the 10 - 100 hz range.
All of the empirical testing was done using the sealed box measurements. I simply simulated the driver (with t/s parameters as measured by Ricci) in the box size and dimensions (as constructed by Ricci) and adjust the Bl in the sim to curve fit the sim to the measurement in the 10 - 100 hz range. I did that for all the large coil drivers he had tested, entered the data into Excel and let Excel provide the adjustment formula. It was at that point that I also ran the sims of the more complex enclosures (ported, flh, tapped horn) with the formula to see if the results were still accurate for these more complex enclosures and the results were very favorable, much better than an unadjusted sim.
So while what you say is true it's not really that important, certainly less important than the other issues I brought up in the previous post.
Last edited:
The driver in question is the lab 15. 3.2ish le vs 4.9 re
This is one of those drivers that is questionable in whether it needs the adjustment or not. While the normalized inductance (Le/Re) is quite high it's not an exceedingly obvious candidate for needing the adjustment. I did not have enough data on this type of driver to study.
The only really obvious way to identify which drivers need adjustment (short of cutting the driver apart and inspecting the voice coil or doing measurements) is to have reliable specs (as opposed to inflated specs like some car audio published specs) that indicate a much larger than average excursion AND power handling capability for it's size. This driver has neither of those. In addition it has a pro sound heritage and they tend to make voice coils differently than the ultra high excursion and power handling drivers.
High normalized inductance by itself may not be enough to ensure the driver needs adjustment, again I didn't have enough (or any) data on this type of moderate driver. Also, on the other hand, a low normalized inductance does not necessarily mean that the driver is not affected by this issue. The Dayton HO has a very low normalized inductance but clearly had a modest measured inductance hump and falling response at higher frequencies that a normal sim does not show, so it is clearly affected by this issue.
I did get reports that the Infinity 1260 (I think that's the model) did get more accurate results by using the adjustment, and that driver is quite similar to the Lab 12 in power handling an excursion. Measurements indicated that that driver did exhibit an inductance hump and falling response at higher frequencies in sealed box measurements. Unfortunately I didn't have high quality professional measurements like Ricci's to study so that driver was not included in my study. The user also reported much higher measured inductance on that driver than published specs would indicate too though. The Lab 12 may show similar results.
I would highly suggest doing a quick sealed box measurement if it's possible. Sim the driver in the sealed box and then measure. if it has an inductance hump and a falling response at higher frequencies that the sim does not show then it is definitely affected by this issue.
And furthermore, if you go to the trouble of doing the closed box sim and measurement you might as well continue with the preferred method by curve fitting the sim to the measurement yourself by adjusting Bl in the sim until the simulated FR curve matches the measurement. This will give slightly more accurate results than using the generic formula in some cases. The generic formula is an average of all the drivers that were tested, your particular driver might not lie right on the average baseline. it shouldn't be far off but a subtle improvement can usually be had if you curve fit to find the best Bl value in this manner. if this isn't clear enough it's explained in detail in the paper I linked to.
Hope this helps.
Last edited:
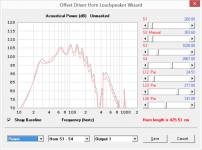
heres a sim vs a "suppossed" measurement (the REW chart). now here's the same sim with the "Large voice coil" option selected. the locations of the peaks are still not quite the same, but it does seem closer. again, this is LAB15
Attachments
The measurements all came from Josh Ricci, posted either on data-bass or in his forum.
Well, that's a bit worrying. It would be nice to see independent confirmation of the FR response for at least some of those devices that contributed to your data.
Well, that's a bit worrying. It would be nice to see independent confirmation of the FR response for at least some of those devices that contributed to your data.
More data is always better, I agree. But it's hard to find high quality measurements. I wanted a data pool as large as possible but only from reputable reliable sources. As far as I know there is no data pool as large as Ricci has compiled, and Ricci is about as reputable and reliable as it gets (again, as far as I know).
He's got his measurement gear and processes clearly listed on the site and (again, as far as I know) no one has ever questioned any of his methods or results.
I also wanted to avoid having a whole bunch of results from different people since even small changes in gear, software, procedure, etc could lead to different results.
If you read the paper that outlines all of this and have any suggestions on things that could be improved I'm willing to give it a shot. I don't own any of the drivers that were tested and don't even have a measurement mic at this point so I can't verify any of the measurements. Besides, due to driver variation you would almost need the measure the same driver he did, not just the same model but the exact same driver. And to be honest, since he's been at it so long if I did find a difference I'd probably assume Ricci's measurements were the more accurate set of data anyway. So I'm not sure how to verify Ricci's work. All I can really say is that I have no reason not to trust it.
Last edited:
heres a sim vs a "suppossed" measurement (the REW chart). now here's the same sim with the "Large voice coil" option selected. the locations of the peaks are still not quite the same, but it does seem closer. again, this is LAB15
The only flh in my study (the only measurement of a flh with this type of driver that I could find at all) was Submaximus built and measured by asarose. This was the only measurement not performed by Ricci and the only enclosure not designed and constructed by Ricci. It's only in there because I really wanted a flh example.
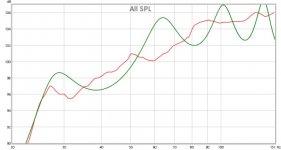
Anyway, first graph shows measured vs simulated (with a non adjusted sim - sim and pic done by LTD02). Green is measured. Driver is Mach 5 UXL in Submaximus flh.
An externally hosted image should be here but it was not working when we last tested it.
Second pic is an adjusted sim vs a non adjusted sim. (Not sure why my unadjusted sim is slightly different than LTD's but whatever, I used his published Hornresp inputs exactly.)
An externally hosted image should be here but it was not working when we last tested it.
The adjusted sim is much closer to the measurement than the unadjusted sim. Especially in regard to the location of the low knee. As you also found the peaks are not in exactly the same spots but the adjusted sim is still clearly more accurate than unadjusted in a few key areas. Not perfect but better.
(There are 50 more examples in the paper too if anyone is interested.)
Last edited:
More data is always better, I agree. But it's hard to find high quality measurements. I wanted a data pool as large as possible but only from reputable reliable sources. As far as I know there is no data pool as large as Ricci has compiled, and Ricci is about as reputable and reliable as it gets (again, as far as I know).
I agree with your comments wrt Josh and his measurements. I suspect however that he'd agree too that other independent measurements need to be considered before developing an observation into a method of procedure for design purposes
. Josh mentions on this site that there are two other public repositories of measurements done to CEA-2010 standards.
Does the B&C 18TBX100 qualify as a "large-coil" subwoofer?
- Home
- Loudspeakers
- Subwoofers
- Hornresp