Hi just a guy,
Power actually used is real power (watts) not apparent power (volt-amperes).
Ein, Pin and Iin are listed in the Hornresp 'All Chart Data' export file, where Pin is the real power, and Ein x Iin is the apparent power.
Pin (electrical power input) is also shown in the Sample tool results for the Acoustical Power chart.
Is this functionality sufficient for your purposes?
Kind regards,
David
I was unaware of the distinction between real power and apparent power. I think Pin is what I'm looking for. I want to know the actual power being used so I know what to expect for thermal considerations.
I've never used the sample tool and never exported all chart data so I was unaware that Hornresp already had this capability, I expected to see it in chart form if it was available. (Maybe I should read the instructions?)
The current functionality is sufficient for my purposes but it would be nice to see the data in chart form instead of single frequency sample form or txt file, so assuming you don't want to add this chart to Hornresp I'll figure out how to graph it in Excel like the attachment you showed. I'm sure it's easy but it's been years since I've used charts in Excel.
Thanks.
Technically it's already possible to sum a Hornresp result and a room gain profile.
Yeah, but not in HornResp's "Loudspeaker Wizard Utility. If it was available there it could remove several steps in the design process.
Hi just a guy,
You are not alone there - from what I can gather it seems that most amplifier manufacturers are not aware of the distinction either") .
.
Apparent power is important when considering the performance of a source such as a voltage amplifier, but real power is important when considering the performance of a complex impedance load such as a loudspeaker.
Because the electrical impedance of a loudspeaker has a reactive component, the apparent power generated by the amplifier will always be greater than or equal to the real power dissipated in the loudspeaker - it can never be less (as shown in the attachment to my earlier post).
Google "apparent power" or "power factor" if you would like to know more. The following link is a good place to start (true power is real power):
True, Reactive, and Apparent power : Power Factor - Electronics Textbook
Amplifier manufacturers should ideally be providing apparent power ratings (in V-A) rather than average power ratings (which they incorrectly call rms watts).
Pin is definitely what you require.
I'll have to think about that one....
Kind regards,
David
I was unaware of the distinction between real power and apparent power.
You are not alone there - from what I can gather it seems that most amplifier manufacturers are not aware of the distinction either
.Apparent power is important when considering the performance of a source such as a voltage amplifier, but real power is important when considering the performance of a complex impedance load such as a loudspeaker.
Because the electrical impedance of a loudspeaker has a reactive component, the apparent power generated by the amplifier will always be greater than or equal to the real power dissipated in the loudspeaker - it can never be less (as shown in the attachment to my earlier post).
Google "apparent power" or "power factor" if you would like to know more. The following link is a good place to start (true power is real power):
True, Reactive, and Apparent power : Power Factor - Electronics Textbook
Amplifier manufacturers should ideally be providing apparent power ratings (in V-A) rather than average power ratings (which they incorrectly call rms watts).
I think Pin is what I'm looking for. I want to know the actual power being used so I know what to expect for thermal considerations.
Pin is definitely what you require.
The current functionality is sufficient for my purposes but it would be nice to see the data in chart form instead of single frequency sample form or txt file
I'll have to think about that one...
.Kind regards,
David
Last edited:
Yeah, but not in HornResp's "Loudspeaker Wizard Utility. If it was available there it could remove several steps in the design process.
Hi Brian,
I am still not sure how much use the proposed feature would actually get, and how much of a demand there is for it.
No one has yet been able to provide me with an example of a real measured gain file...
.Kind regards,
David
I'll have to think about that one...
Kind regards,
David
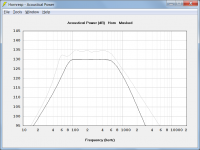
Whatever you decide is fine. It would be nice to have it as a graph in Hornresp but I figured out how to chart it in Excel in 10 minutes so I'm good now. Pin for a big tapped horn shown.
An externally hosted image should be here but it was not working when we last tested it.
Thanks for the detailed explanation of real vs apparent power. Interesting stuff.
Last edited:
Hi Brian,
I am still not sure how much use the proposed feature would actually get, and how much of a demand there is for it.
No one has yet been able to provide me with an example of a real measured gain file...
Kind regards,
David
It takes a bit of thinking to generate one.
You have to measure and EQ a box outside as a groundplane measurement. Then take same said setup inside and without changing anything measure the difference.
The overall floor will rise because of there being reflection points. But the difference will be the 'house' curve. And it is not always gain. It is quite often nulls and peaks, then below about 30 hertz gain.
I figured out how to chart it in Excel in 10 minutes so I'm good now.
Hi just a guy,
Excellent
.If you save your current Excel file as a master, you can then just copy and paste new data into the worksheet Pin column and save with a different filename, rather than having to go through the process of generating a new chart each time.
Kind regards,
David
It takes a bit of thinking to generate one.
Hi Mark,
That's what I suspected - coming up with accurate normalised gain values for a given environment could be rather tricky.
Kind regards,
David
Doesn't seem to matter which restaurant I eat at, they all serve Chinese food!
No McDonald's?
.No McDonald's?
Yes.
Unfortunately.
Arrived on August 16th. Will be here until the 29th of September. I am actually starting to enjoy eating rice.
I'm in big trouble.
I think Pin is what I'm looking for. I want to know the actual power being used so I know what to expect for thermal considerations.
Hi just a guy,
Not sure if it helps at all, but if the normal response is compared to the Maximum SPL response with Xmax set to 99.9, and the normal response is within the Maximum SPL response envelope, then Pin has not exceeded Pmax at any frequency. See attached example for the default record with Eg changed to 20 volts - light grey trace is Maximum SPL response.
Kind regards,
David
Attachments
David are you in Perth?
I'm in Australia, "the Land Down Under" - my precise location is classified
.Hi Brian,
I am still not sure how much use the proposed feature would actually get, and how much of a demand there is for it.
No one has yet been able to provide me with an example of a real measured gain file...
Kind regards,
David
See attached. Note - it doesn't include phase. This is what I measured for my Hyundai Tucson, and I use it in my ported.xls spreadsheet to give a better idea of what to expect when I design subwoofers for it.
Adding the effect of a TF to a modelled response curve should be pretty simple - my suggestion would be to just have a facility to import it (a process which will convert the measurements to another file that matches the frequency sample points used in HornResp via a geometric mean process), then it's just a matter of adding the imported TF to the modelled FR. Maybe a selectable "include TF" option like the "show baseline" option in the Loudspeaker Wizard.
As for usage, it would be of benefit to those who design for car audio duty. Like me
. It will definitely show how an alignment designed for maximally-flat response with low F3 can pretty much sound like flabby crap when installed in a vehicle.Attachments
Hi just a guy,
Not sure if it helps at all, but if the normal response is compared to the Maximum SPL response with Xmax set to 99.9, and the normal response is within the Maximum SPL response envelope, then Pin has not exceeded Pmax at any frequency. See attached example for the default record with Eg changed to 20 volts - light grey trace is Maximum SPL response.
Kind regards,
David
I have very little interest in Pmax other than using it as a vague guideline when selecting drivers to simulate. Most manufacturers don't mention the test signal used to determine their power rating, the duration of the signal applied or the thermal compression losses over time at the rated power handling. And no mention of the enclosure used to test power handling. Some manufacturers go a lot farther than others, for example 18sounds publishes the -3 and -10db power compression loss right in the specs - 140 18NLW9600 - 18NLW9600 : Eighteen Sound - professional loudspeakers - and I imagine if I looked around a bit I could probably find out what test signal they use to determine this rating, the duration of the test signal, the bandwidth the signal was applied to, and possibly even the enclosure used to test the power handling. But this level of information is VERY rare with other manufacturers, and even when it is provided it's impossible to guess if the engineers or the marketing dept had more influence in the published spec. On the other end of the spectrum is the cheap car audio subs with gaudy baskets and huge power ratings printed on the cone in large lettering. We all know they can't handle even a fraction of their rated power.
Here's a quick example of what I'm doing, which will give an overview of my search for real information that I can apply to my own projects.
I'm looking at a specific driver. It's high excursion, fairly high Le, but half the price of premium drivers with similar excursion that have lower Le. It's rated for 1500 watts RMS by the manufacturer but it's been tested on data-bass.com in a 4.2 cu ft sealed box at levels of almost 121V, which is almost 8500 watts into it's Re. It showed just over 4 db of compression at almost 121V and just over 2 db of compression at almost 68V, which is close to 2750 watts into Re. This is all interesting info but since the manufacturer does not give any info about how the rating was determined, and since I'm not interested even slightly in a 4.2 cu ft sealed box, none of this info really means anything at all for my specific purposes without further investigation.
From data-bass.com we know that for the long term output compression sweeps "the response is measured using an ascending 0-120hz sine wave sweep of 24 second duration." That's not a long time but it is a demanding signal. Next step is to sim the driver in the same box that data-bass.com used and figure out how much power it's actually consuming. Simulated here at a bit more than 82V, or 4000 watts into Re.
An externally hosted image should be here but it was not working when we last tested it.
On the forum, we would usually state that this was simulated at 4000 watts, but realistically over most of the sub's bandwidth it's not using anywhere near 4000 watts and the average power used is fairly low. This is a big part of the reason why I regularly show sims at significantly more power than the driver is rated for.
Now I have a pretty good idea of how much power was ACTUALLY consumed, and how much compression shows at that level - it should be about 2.5 db of compression at this power level. Unfortunately that still doesn't mean anything at all in my own design.
So here's an example tapped horn design with the same driver, shown at a bit over 82V or 4000 watts into Re and the Pin I showed yesterday.
An externally hosted image should be here but it was not working when we last tested it.
An externally hosted image should be here but it was not working when we last tested it.
Since some frequencies are well above the rated power handling I need to know if this voltage will destroy the driver, and if not how much compression I will be likely to see.
There will be a low pass and a high pass in real world usage, and this fairly high inductance driver probably won't be much good past 80 hz, definitely no higher than 100 hz, so the only frequencies where the power exceeds the rating are between 21 and 28 hz (centered at 25 hz) and between 38 and 63 hz (centered at 53 hz). Since it's unlikely that I will encounter a sustained high density signal at 25 or 53 hz in regular music (bass lines are usually between 28 and 40 hz in most music) it's extremely unlikely that I will destroy the driver at this power level. For compression estimates, I am averaging Pin over the usable range of 25 - 80 hz in this design and comparing it to the average Pin over the range of 0 - 120 hz in the sealed design tested by data-bass.com and I would guess that compression will be similar in both designs, maybe slightly higher in the tapped horn if both designs were tested at just over 82V with data-bass.com's test protocol.
By looking at a few graphs I've determined that 82V into my design should not destroy the driver, and I estimate that with long term sustained 82V power level with musical content the power compression should be between 2 and 4 db depending on the power density contained in the media.
Sorry for the long post but hopefully this explains in detail why I feel the Pin graph is so important for designs that intend to meet or exceed the driver's published power rating in regular usage.
See attached.
Hi Brian,
Thanks for the sample file.
I will have to think some more about how the proposed feature could best be implemented in Hornresp, bearing in mind that only part of the 10 to 20000 Hz chart range would be affected by adding in the gain values from the import file, which has a smaller frequency range.
I will assume that the import file decimal separator will always be a period, that the frequency and gain fields will be Tab delimited, and that a '.txt' rather than a '.frd' extension will be used, as is the case for your sample file.
Kind regards,
David
- Home
- Loudspeakers
- Subwoofers
- Hornresp