You mean you are looking to be able to incorporate a room gain curve for a home or an automobile.
Interesting.
Might be doable if it were in an FRD format.
Yup, that's exactly what I was referring to. A discussion of the format is given here - Sound, Vibration and a Little Noise | .FRD file format - can’t we all just get along?
If phase data is not provided, zero phase should be assumed.
Making a boat load of drivers:
Are you designing / making the perfect TH pro audio driver too?
You know, Fs~40 Hz, Qt~0.3, Xmax > 12mm and Eff > 96dB
")
Are you designing / making the perfect TH pro audio driver too?
You know, Fs~40 Hz, Qt~0.3, Xmax > 12mm and Eff > 96dB
In order of answers:
Fs-YES
Qt-YES
X-Max-34mm
Eff-93-94db
And the cost?
Think TC Sounds Pro Pricing.
Hi Mark,
And very nice they look, too.
Firefox?.
Kind regards,
David
Making a boat load of drivers:
And very nice they look, too
.I bet you can't guess which program I'm talking about!
Firefox?
.Kind regards,
David
Hi Mark,
And very nice they look, too
Firefox?
Kind regards,
David
Thanks!
Oh not Firefox.
Chrome!
Or possibly Hornresp.
Just wanted to say thanks for getting me back on track. The Harry Olson reference was especially helpful.
Hi Paul,
Excellent - thanks for the feedback!
If you are interested in delving deeper, Beranek has some good information on the calculation of Directivity Factor and Directivity Index, which is not covered by Olson's book.
Kind regards,
David
Last edited:
Yup, that's exactly what I was referring to. A discussion of the format is given here - Sound, Vibration and a Little Noise | .FRD file format - can’t we all just get along?
If phase data is not provided, zero phase should be assumed.
Hi Brian,
As Sabbelbacke has highlighted, the stumbling block to implementing the proposed feature in Hornresp would appear to be the lack of a standardised format for the room gain data import file. There seems to be some uncertainty as to the choice of a decimal separator - it can be either a period ( . ) or a comma ( , ). There is also the question of the data record separator - it can be a space ( ), a comma ( , ), a semi-colon ( ; ) or possibly some other character. Also, what data values are actually provided, and in what order? Hornresp would require the room gain in dB normalised to a zero reference point, at a number of different frequencies.
The most suitable format for Hornresp would be a *.txt text file, with a data line containing, for example:
1000.0,-5.0
Where 1000.0 is the frequency (1000 Hz) and -5.0 is the normalised gain (-5 dB relative to the zero reference point).
If the frequency and gain values can be expressed as whole numbers, then there would be no need for a decimal separator, and this aspect would no longer be an issue. It would then be possible to simply look for a non-numeric character in the complete data string and assume that this was the record separator.
The format would then become:
1000*-5
Where * could be any non-numeric character, acting as the record separator.
In light of the above file formatting issues, where do we go from here..?
Kind regards,
David
Last edited:
Not quite.....
Here's a glass half full viewpoint.
There is a fairly standardized set of file methods in most test and measurement gear.
CLIO, LEAP,LOUDSOFT,SPEAKERTESTERPRO, LMS the grand Daddy of all of them saves in a similar file format. All of them make files that each other can interchange. And there are programs to ease file changes as well.
And it is FRD that many of them have in common.
The free test and measurement suites like REW and ARTA also can work with this.
So FRD is a possibility with a fair amount of support and interoperability if you are interested in this as a function in Hornresp.
Hi Brian,
As Sabbelbacke has highlighted, the stumbling block to implementing the proposed feature in Hornresp would appear to be the lack of a standardised format for the room gain data import file. There seems to be some uncertainty as to the choice of a decimal separator - it can be either a period ( . ) or a comma ( , ). There is also the question of the data record separator - it can be a space ( ), a comma ( , ), a semi-colon ( ; ) or possibly some other character. Also, what data values are actually provided, and in what order? Hornresp would require the room gain in dB normalised to a zero reference point, at a number of different frequencies.
The most suitable format for Hornresp would be a *.txt text file, with a data line containing, for example:
1000.0,-5.0
Where 1000.0 is the frequency (1000 Hz) and -5.0 is the normalised gain (-5 dB relative to the zero reference point).
If the frequency and gain values can be expressed as whole numbers, then there would be no need for a decimal separator, and this aspect would no longer be an issue. It would then be possible to simply look for a non-numeric character in the complete data string and assume that this was the record separator.
The format would then become:
1000*-5
Where * could be any non-numeric character, acting as the record separator.
In light of the above file formatting issues, where do we go from here..?
Kind regards,
David
Here's a glass half full viewpoint.
There is a fairly standardized set of file methods in most test and measurement gear.
CLIO, LEAP,LOUDSOFT,SPEAKERTESTERPRO, LMS the grand Daddy of all of them saves in a similar file format. All of them make files that each other can interchange. And there are programs to ease file changes as well.
And it is FRD that many of them have in common.
The free test and measurement suites like REW and ARTA also can work with this.
So FRD is a possibility with a fair amount of support and interoperability if you are interested in this as a function in Hornresp.
Hi Mark,
I would need someone to provide me with a real-life example of a room gain FRD file, to see if I can successfully identify and extract the required information (frequency, and gain in dB normalised to a zero reference point).
Kind regards,
David
So FRD is a possibility with a fair amount of support and interoperability if you are interested in this as a function in Hornresp.
I would need someone to provide me with a real-life example of a room gain FRD file, to see if I can successfully identify and extract the required information (frequency, and gain in dB normalised to a zero reference point).
Kind regards,
David
Hi Mark,
I would need someone to provide me with a real-life example of a room gain FRD file, to see if I can successfully identify and extract the required information (frequency, and gain in dB normalised to a zero reference point).
Kind regards,
David
Here's a small excerpt from a .frd file. It's not a room gain profile but it doesn't matter, a .frd is a .frd.
10.0000 30.01530 -28.53414
10.1517 30.54450 -28.89605
10.3056 31.07400 -29.30461
10.4619 31.60360 -29.74008
10.6205 32.13350 -30.18569
10.7816 32.66350 -30.62987
10.9451 33.19370 -31.06674
11.1111 33.72420 -31.52277
11.2796 34.25490 -32.00620
11.4507 34.78570 -32.48738
11.6243 35.31690 -32.95633
11.8006 35.84820 -33.46007
11.9795 36.37980 -33.97504
12.1612 36.91170 -34.47095
12.3456 37.44380 -35.00639
12.5329 37.97610 -35.54018
12.7229 38.50870 -36.07585
12.9159 39.04160 -36.64226
13.1117 39.57480 -37.18890
13.3106 40.10830 -37.78131
13.5124 40.64200 -38.34840
Frequency, amplitude, phase in columns. No headers or footers or anything else at all. File extension is .frd. Not sure if this shows what you want or not. This file should open in all decent programs that accept .frd files. If you are going to get involved with this stuff it would be good to be able to export .frd and .zma.
Technically it's already possible to sum a Hornresp result and a room gain profile. A program like SPL Copy or SPL Trace makes a .frd from a picture of the response curve, then a program like Response Modeler will import both files, extract minimum phase and sum them into a single summed .frd. You can view the curve in Response Modeler or export it.
A quick look at SPL Copy (or SPL Trace) and Response Modeler will show what .frd and .zma files are all about and how they can be created and used.
Hi Mark,
Great to see that the world is still turning, and getting smaller.
Xmax=34mm (one way?) that's ambitious
Regards,
Useful.
But just fairly simple engineering.
Big enough basket for the excursion.
Strong enough motor for the desired efficiency and linearity.
And a very high quality build house to make sure it gets built as designed.
This build house did the initial runs of the Pro version of TCSounds. The ones that met specifications.
Anyway. This thread is for Hornresp not what I'm working on.
Sorry David.
Hi just a guy,
Many thanks - it seems that it would be relatively easy to extract the data values, if required.
In that case I probably won't include the feature in Hornresp - not at the moment anyway.
It would take a bit of work, and from what I can gather there doesn't appear to be a pressing need for it. One for the "back burner", it seems.
Sorry Brian.
Kind regards,
David
Here's a small excerpt from a .frd file.
Many thanks - it seems that it would be relatively easy to extract the data values, if required.
Technically it's already possible to sum a Hornresp result and a room gain profile.
In that case I probably won't include the feature in Hornresp - not at the moment anyway.
It would take a bit of work, and from what I can gather there doesn't appear to be a pressing need for it. One for the "back burner", it seems.
Sorry Brian
.Kind regards,
David
Last edited:
Sorry David.
Not a problem Mark - I started it all by asking what you had been up to
.In that case I probably won't include the feature in Hornresp - not at the moment anyway.
Kind regards,
David
In that case here's a bit of explanation. I'm sure Brian knows all about these tools but in case anyone else needs to do this, here's how.
First you need a picture of your frequency response curve. Just do a screen cap of the Hornresp Acoustical Power screen.
Next you need to turn that picture into a .frd file. Use SPL Copy or SPL Trace to import the picture of the frequency response and trace the curve. SPL Trace is the original but if you don't want to click 400 times SPL Copy does the job for you (mostly).
SPL Tools
SPL Copy - Speaker Frequency Response Automatic Trace Tool
Now you need a room gain profile. Create it by doing measurements or by simulation. If you want to sim it use Bagby's Diffraction and Boundary Simulator.
Loudspeaker Design Software
Turn the diffraction part off and just use the rest of the program as pictured below. This program will save the results as a .frd file. If you use measurements instead of a sim you will have to trace a picture of the response curve with the programs in the preceding paragraph to create the .frd file yourself.
An externally hosted image should be here but it was not working when we last tested it.
Now import both files into Bagby's Response Modeler.
Loudspeaker Design Software
They sum automatically and that's about all there is to it. If you wanted to work with the summed file more you could extract minimum phase, save the result as a .frd and import it into other programs.
Bagby's spreadsheets need MS Excel to run, preferably 2003 or 2010.
While I'm here maybe I could request a new feature.
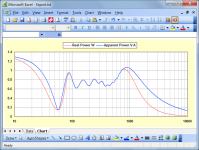
WinISD has a screen they call "Amplifier apparent load power (VA)". It shows how much power is ACTUALLY being used.
In the screenshot below you can see that driver input voltage is set at 74.5V (1500 watts) but the curve shows that over most of the bandwidth of a subwoofer not even close to 1500 watts is being produced or consumed.
Since this info is very similar to the inverse of the impedance curve this is not surprising or even unexpected but it is useful info and it would be nice if Hornresp had this info like WinISD does. I don't think Hornresp does anything like this currently. This is especially important for people that want to push the limits of thermal considerations in their designs, and it's important because many designs simulated in Hornresp have a lot of impedance peaks, meaning that the apparent amplifier load is CONSIDERABLY different than the set voltage as set in the Eg input box over the entire design's bandwidth. Again, not surprising but good info to have.
An externally hosted image should be here but it was not working when we last tested it.
In that case here's a bit of explanation.
Excellent - thanks just a guy.
Kind regards,
David
Hi just a guy,
Power actually used is real power (watts) not apparent power (volt-amperes).
Ein, Pin and Iin are listed in the Hornresp 'All Chart Data' export file, where Pin is the real power, and Ein x Iin is the apparent power.
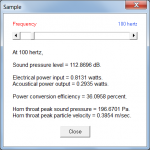
Pin (electrical power input) is also shown in the Sample tool results for the Acoustical Power chart.
Is this functionality sufficient for your purposes?
Kind regards,
David
While I'm here maybe I could request a new feature.
WinISD has a screen they call "Amplifier apparent load power (VA)". It shows how much power is ACTUALLY being used.
Power actually used is real power (watts) not apparent power (volt-amperes).
Ein, Pin and Iin are listed in the Hornresp 'All Chart Data' export file, where Pin is the real power, and Ein x Iin is the apparent power.
Pin (electrical power input) is also shown in the Sample tool results for the Acoustical Power chart.
Is this functionality sufficient for your purposes?
Kind regards,
David
Attachments
Last edited:
- Home
- Loudspeakers
- Subwoofers
- Hornresp