Do both total and (net) within brackets.
Hi David_Web,
Because system efficiency is also given, I would prefer to show just one value for acoustical output power to avoid any confusion as to how efficiency is calculated - I don't want to include two separate efficiency figures.
Unless anyone can see a good reason not to, I think I will probably just change the acoustical output power to show the net or 'combined system' value rather than the total or 'sum of the components' value.
If a user still wants to know the total acoustical power, then they can readily manually add the two known individual power outputs together.
Kind regards,
David
Does that mean that the efficiency figure or graph was incorrect for BR or other two source designs?
Back Loaded Horns?
In practice and using measurements I don't find it to far different.
But I'm not working on the math end. I'm working on the end of the line...
Had to do it.
Just to much temptation.
Does that mean that the efficiency figure or graph was incorrect for BR or other two source designs?
Hi David_Web,
An interesting philosophical question. It depends on how system efficiency is defined. The existing figure is calculated as [total acoustical output power] / [total electrical input power] * 100. The proposed new figure will be calculated as [net acoustical output power] / [total electrical input power] * 100.
Both values are correct, it's just that the proposed new figure will probably be more useful in that it gives the net efficiency of the practical system, rather than the total efficiency of the two separate sources.
Kind regards,
David
Back Loaded Horns?
Hi Mark,
Yes, those also.
Kind regards,
David
An interesting philosophical question. It depends on how system efficiency is defined. The existing figure is calculated as [total acoustical output power] / [total electrical input power] * 100. The proposed new figure will be calculated as [net acoustical output power] / [total electrical input power] * 100.
Strictly speaking, the total acoustical power should be calculated by integrating over the solid angle into which the loudspeaker radiates. The power may be different in different directions, but the total, integrated power should be the same as the power dissipated in the radiation resistance(s), unless there are losses in the medium. There may be large dips in the response at certain angles due to phase cancellations, but these will be compensated by reinforcements in other directions.
Regards,
Bjørn
Strictly speaking, the total acoustical power should be calculated by integrating over the solid angle into which the loudspeaker radiates. The power may be different in different directions, but the total, integrated power should be the same as the power dissipated in the radiation resistance(s), unless there are losses in the medium. There may be large dips in the response at certain angles due to phase cancellations, but these will be compensated by reinforcements in other directions.
Hi Bjørn,
Many thanks for your insight. It seems that the Hornresp acoustical output power shouldn't be changed after all
") .
.Kind regards,
David
Yes it should, as now the acoustical power between TH and BR for example can't be compared. Which would mean that the efficiency graph is incorrect for BR. Right?
I thought the SPL graph was already the power response thus already "integrated"?
Directivity is not available when choosing combined result anyway.
I guess it's a question of being correct at the simple lever or never be correct. You have to sum the port and driver part of a BR if it's in the same room, with it's cancellations. Otherwise it would be radiating into two different rooms, which you could already check without the combined response tool.
Adding the two figures together is easy, getting the net output without generating it inside the software would be hard. So changing it would be more user friendly.
Adding the two figures together is easy, getting the net output without generating it inside the software would be hard. So changing it would be more user friendly.
Hi David_Web,
A compelling argument
. I will make the change.Kind regards,
David
Hornresp Update 3300-131130
Hi Everyone,
CHANGE 1
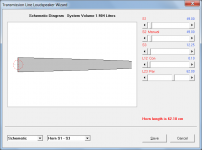
The Loudspeaker Wizard tool can now simulate transmission line loudspeakers containing absorbent filling material. See the Hornresp Help file for details (search for references to transmission line using the Find tool).
CHANGE 2
The airflow resistivity parameter Fr is now specified in units of mks rayls/m rather than cgs rayls/cm, where 1 cgs rayl/cm equals 1000 mks rayls/m. Existing Fr values will be automatically updated the first time that the new version is run.
CHANGE 3
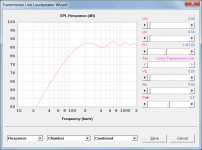
Charts are now provided showing front and rear horn throat, horn mouth, port inlet and port outlet velocities and pressures as appropriate, for the specified loudspeaker system. Charts showing the direct pressure on each side of the driver diaphragm are also provided. My thanks to James (jwmbro) for suggesting this enhancement.
CHANGE 4
The Sample tool now shows the net value for combined response acoustical output power, rather than the summed outputs of the two sources. This means that the combined response system efficiency figures will also change. My thanks to James again, for initially raising this issue.
CHANGE 5
Setting the D3 slider to zero in the Driver Front Volume tool generated a fatal Overflow error. This bug has now been fixed.
Kind regards,
David
Hi Everyone,
CHANGE 1
The Loudspeaker Wizard tool can now simulate transmission line loudspeakers containing absorbent filling material. See the Hornresp Help file for details (search for references to transmission line using the Find tool).
CHANGE 2
The airflow resistivity parameter Fr is now specified in units of mks rayls/m rather than cgs rayls/cm, where 1 cgs rayl/cm equals 1000 mks rayls/m. Existing Fr values will be automatically updated the first time that the new version is run.
CHANGE 3
Charts are now provided showing front and rear horn throat, horn mouth, port inlet and port outlet velocities and pressures as appropriate, for the specified loudspeaker system. Charts showing the direct pressure on each side of the driver diaphragm are also provided. My thanks to James (jwmbro) for suggesting this enhancement.
CHANGE 4
The Sample tool now shows the net value for combined response acoustical output power, rather than the summed outputs of the two sources. This means that the combined response system efficiency figures will also change. My thanks to James again, for initially raising this issue.
CHANGE 5
Setting the D3 slider to zero in the Driver Front Volume tool generated a fatal Overflow error. This bug has now been fixed.
Kind regards,
David
Attachments
#1 Wow, this will make a LOT of sleepless nights.
#2 I don't really know what they mean in the first place though, someone have a table for some common stuffing materials?
#3 Now the pressure on the diaphragm is really nice, especially in a TH.
#4 This will make it a lot easier to compare different designs, especially when raw power is desired.
#2 I don't really know what they mean in the first place though, someone have a table for some common stuffing materials?
#3 Now the pressure on the diaphragm is really nice, especially in a TH.
#4 This will make it a lot easier to compare different designs, especially when raw power is desired.
Post #3790
Hi David,
Amazing, especially (for me) the ability to evaluate stuffing in transmission lines. Does anyone have a source for how the Hornresp units compare to e.g.: pounds of fiberfill stuffing per cubic foot?
So much to learn, so little time.
Thank you, Best Regards,
Hi David,
Amazing, especially (for me) the ability to evaluate stuffing in transmission lines. Does anyone have a source for how the Hornresp units compare to e.g.: pounds of fiberfill stuffing per cubic foot?
So much to learn, so little time.
Thank you, Best Regards,
Does anyone have a source for how the Hornresp units compare to e.g.: pounds of fiberfill stuffing per cubic foot?
I can do a side by side test with MJK's software to find out, if you want. Not sure if I can do it today but I was planning to do it soon anyway since I saw this update. There might be some behind the scenes calculations that might make the results between the two programs directly comparable but this should give a pretty good idea of what's going on. I might test and compare against TL.app too while I'm at it, to see what the stuffing numbers mean in that program too.
Give me a design you would like tested and compared and I'll run the numbers.
Last edited:
These are exciting changes. I have a couple of notes though.
I've been requesting this for years so I'm very happy to see this new feature.
I've only had a few minutes to play with it but it doesn't seem like stuffing can be isolated into particular segments. This would be very useful since stuffing in the first half of the line mainly attacks the harmonic spikes higher up in frequency with no negative side effects but stuffing placed anywhere near the mouth aggressively attacks output down near tuning. So it would be very useful to be able to place stuffing in particular segments instead of having the line fully stuffed.
Also it would allow us to play with stuffing in tapped horns (assuming stuffing is available in tapped horn sims, I haven't checked yet), so we could try a bit of stuffing in the throat and mouth like some of Danley's designs like the DTS10.
I was pretty excited about this when I ran a sim and the chart was labelled "Horn Diaphragm Peak Pressure". I thought this was going to show pressure on the driver diaphragm itself, which I've been using Akabak for. But upon comparison it's not showing pressure on the diaphragm, it's showing "Horn Throat Peak Sound Pressure", same as the previous version of Hornresp.
I don't find it particularly useful to see pressure in the rear chamber or at the horn throat (unless we can use this to somehow figure out reactance annulling, and if so I'd appreciate some instructions on how to use this info for that purpose). I'm not suggesting these should be removed, I just don't see a practical purpose for this info at the moment.
I find it much more useful to see pressure on the cone itself, this is what really matters to determine if the cone is under too much stress. It would be nice and extremely convenient if you could add a feature to show pressure on the cone too, otherwise I can continue to use Akabak for this info.
Like I said, these are exciting changes but hopefully you can go just a bit further with them.
Hi Everyone,
CHANGE 1
The Loudspeaker Wizard tool can now simulate transmission line loudspeakers containing absorbent filling material. See the Hornresp Help file for details (search for references to transmission line using the Find tool).
I've been requesting this for years so I'm very happy to see this new feature.
I've only had a few minutes to play with it but it doesn't seem like stuffing can be isolated into particular segments. This would be very useful since stuffing in the first half of the line mainly attacks the harmonic spikes higher up in frequency with no negative side effects but stuffing placed anywhere near the mouth aggressively attacks output down near tuning. So it would be very useful to be able to place stuffing in particular segments instead of having the line fully stuffed.
Also it would allow us to play with stuffing in tapped horns (assuming stuffing is available in tapped horn sims, I haven't checked yet), so we could try a bit of stuffing in the throat and mouth like some of Danley's designs like the DTS10.
CHANGE 3
Charts are now provided showing front and rear horn throat, horn mouth, port inlet and port outlet velocities and pressures as appropriate, for the specified loudspeaker system. Charts showing the direct pressure on each side of the driver diaphragm are also provided. My thanks to James (jwmbro) for suggesting this enhancement.
I was pretty excited about this when I ran a sim and the chart was labelled "Horn Diaphragm Peak Pressure". I thought this was going to show pressure on the driver diaphragm itself, which I've been using Akabak for. But upon comparison it's not showing pressure on the diaphragm, it's showing "Horn Throat Peak Sound Pressure", same as the previous version of Hornresp.
I don't find it particularly useful to see pressure in the rear chamber or at the horn throat (unless we can use this to somehow figure out reactance annulling, and if so I'd appreciate some instructions on how to use this info for that purpose). I'm not suggesting these should be removed, I just don't see a practical purpose for this info at the moment.
I find it much more useful to see pressure on the cone itself, this is what really matters to determine if the cone is under too much stress. It would be nice and extremely convenient if you could add a feature to show pressure on the cone too, otherwise I can continue to use Akabak for this info.
Like I said, these are exciting changes but hopefully you can go just a bit further with them.
Stuffing Comparison
I tried to match the graphs up as well as possible as far as response vs amount of stuffing but like I mentioned these two programs calculate and show some things differently so it's impossible to make a perfect match. Hopefully these results are in the right range though. Maybe I should have used a bit more than 125 in the Hornresp graph in the third row, it's hard to tell for sure.
Top row - MJK and Hornresp inputs - check my work, if this isn't correct nothing else will be
Second row - response with no stuffing
Third row - response with .25 lb/ft stuffing in MJK's software
Fourth row - response with .5 lb/ft stuffing in MJK's software
Fifth row - response with .75 lb/ft stuffing in MJK's software
I didn't go any further than .75 lb/ft, if you need more than that you are doing it wrong, especially if the whole line from beginning to end is stuffed.
MJK's software assumes polyfil stuffing.
An externally hosted image should be here but it was not working when we last tested it.
Last edited:
Hi just a guy,
I will keep your comment in mind for the future - I'm not sure at this stage how difficult it would be to implement, though.
Currently only available in offset driver horns.
The Horn Diaphragm Peak Pressure and Horn Throat Peak Sound Pressure chart results will be identical if no throat chamber is present, or if a throat chamber exists and the resonances masked option is selected. With a throat chamber present and resonances not masked, the results will be different. If the chamber has a small volume and short length, the differences might not be immediately obvious to the casual observer.
Rear Chamber Diaphragm Peak Pressure is the pressure on the side of the diaphragm facing into the rear chamber.
Kind regards,
David
So it would be very useful to be able to place stuffing in particular segments instead of having the line fully stuffed.
I will keep your comment in mind for the future - I'm not sure at this stage how difficult it would be to implement, though.
Also it would allow us to play with stuffing in tapped horns (assuming stuffing is available in tapped horn sims, I haven't checked yet),
Currently only available in offset driver horns.
I was pretty excited about this when I ran a sim and the chart was labelled "Horn Diaphragm Peak Pressure". I thought this was going to show pressure on the driver diaphragm itself, which I've been using Akabak for. But upon comparison it's not showing pressure on the diaphragm, it's showing "Horn Throat Peak Sound Pressure", same as the previous version of Hornresp.
The Horn Diaphragm Peak Pressure and Horn Throat Peak Sound Pressure chart results will be identical if no throat chamber is present, or if a throat chamber exists and the resonances masked option is selected. With a throat chamber present and resonances not masked, the results will be different. If the chamber has a small volume and short length, the differences might not be immediately obvious to the casual observer.
I don't find it particularly useful to see pressure in the rear chamber
Rear Chamber Diaphragm Peak Pressure is the pressure on the side of the diaphragm facing into the rear chamber.
Kind regards,
David
So it would be very useful to be able to place stuffing in particular segments instead of having the line fully stuffed.
I agree
The Horn Diaphragm Peak Pressure and Horn Throat Peak Sound Pressure chart results will be identical if no throat chamber is present, or if a throat chamber exists and the resonances masked option is selected. With a throat chamber present and resonances not masked, the results will be different. If the chamber has a small volume and short length, the differences might not be immediately obvious to the casual observer.
Rear Chamber Diaphragm Peak Pressure is the pressure on the side of the diaphragm facing into the rear chamber.
Kind regards,
David
Thanks for the response. Please understand that I'm not trying to be argumentative here, I just don't see the point of looking at the pressure at "Duct Rear chamber" and "Duct Throat chamber" (as they are named in Akabak) separately. The Akabak Help file isn't really helpful with this topic, maybe you can explain why this info is useful.
As I mentioned, I've been using Akabak to look at "Driver (diaph) Driver", which is defined in Akabak Help file under "Sum, Inspect - Pressure - Specials - Driver Element" as:
"This simulation displays the pressure across the acoustical poles, i.e. between the front and rearward side of the diaphragm."
As far as I can tell, the only reason to look at pressure inside the horn at all is to find out how much stress the driver diaphragm is under, and the only graph that will show that is "Driver (diaph) Driver" - and this one graph is not currently available in Hornresp.
I can't figure out why it would be useful to look at pressure on either individual side of the cone but not look at the summed pressure on the cone itself. Maybe I'm misinterpreting something somewhere along the line, but I would appreciate your thoughts on this.
- Home
- Loudspeakers
- Subwoofers
- Hornresp