As a followup on the update notification:
Works very well.
Still have to figure out what the editor will do.
But very interesting.
Hi Mark,
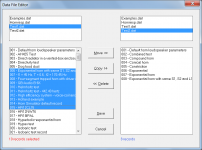
Thanks for the feedback. To better understand how the Hornresp Data File Editor works, try the following:
1. Create a new data file using the File > New menu command.
2. Open the Data File Editor using the File > Editor menu command.
3. Click on the Hornresp.dat file name in the top left or right box.
4. Select a number of Hornresp.dat records to move or copy to the new file, or to delete from Hornresp.dat.
The Editor allows those Hornresp users with lots of records * to organise things better by storing their data in various different files if they wish.
Kind regards,
David
* A Hornresp "Grand Master" is a user with more than 1000 records
") .
.Attachments
The equation for a Parabola is Y = a.X² + C
We have our two Areas: S1 and S2. From these we can calculate Y1 and Y2.
Y1 = SQRT[S1 / PI]
Y2 = SQRT[S2 / PI]
if we assume that the element starts at 0 and ends at L12 then:
X1 = 0
X2 = L12 (Length)
a and c can be calculated from:
a = [Y2 - Y1] / [X2² - X1²]
c = Y1 - aX1²
We can then calculate the area at any point along the segment by
Y = a.X² + C
S = PI.Y²
Hi schmeet,
You have assumed that X1 = 0. Isn't X1 the axial distance from the parabola vertex to the point at which Y = Y1?
Kind regards,
David
schmeet appears to have his x's and y's crossed...
"wires" crossed, get it? Oh, never mind...
I think it should read:
X1 = SQRT[S1 / PI]
X2 = SQRT[S2 / PI]
Y1 = 0
Y2 = L12 (Length)
S for any value of Y can be found as follows:
s = ((y - c) / a) * pi
His method is the same as I have been using. I also like your method because it avoids converting from area to radius and back.
Hi just a guy,
Further to my earlier post about keeping things in perspective, I think you might find in practice that it really doesn't make much of a difference if multiple parabolic segments or multiple conical segments are used in the simulation model. To illustrate, the attached screenprint compares the SPL response of a tapped horn having three conical segments against the response of the same horn, but with three parabolic segments. You can see that the traces are effectively identical. Greater inaccuracies are already inherent in the predictions due to the assumption that the driver diaphragm acts as a rigid plane piston at all frequencies, and that there are no losses due to panel vibrations, etc.
Kind regards,
David
Hi, I agree with you in most cases it won't have much effect. But it only took me about 3 minutes to create this mess. I'm pretty sure I could show a much worse example if I spent more time on it.
An externally hosted image should be here but it was not working when we last tested it.
The only difference between these two lines is PAR vs CON segments and my lines don't overlay nearly as nicely as yours. I noticed this problem almost immediately when Hornresp allowed PAR segments. I don't remember which model caused me the most trouble but I've seen examples much worse than I've posted here.
As I pointed out originally this isn't a fatal flaw, it doesn't seem to shift the peaks right or left (which would be really bad) it just changes the amplitude a bit. Even though this isn't bad I would prefer to avoid surprises like this. In very large horns, 2 db at tuning can be a difference of hundreds of liters of enclosure size. I'd really like to be as accurate as possible when I fold.
Although I haven't studied in depth what factor is causing this, I think it's one or more very long segments that will cause this discrepancy.
(I got the mail, thanks!)
Last edited:
* A Hornresp "Grand Master" is a user with more than 1000 records
Aew man!
lost 400+ a few years ago and have 440
Still not a grand master!
But I'm working on it!
I guess so, but it makes more sense to me that x is the axis along the length of the pipe and y is its radius.
True, it makes sense to "lay it on its side". The trouble is that you mixed your axes in your example - some of your values were for a "horizontal" parabola, some were for an "upright" parabola.
Hi Don and schmeet,
Thanks for the clarifications – everything makes sense now.
In summary:
Assuming that X is axial length and Y is radius, the equation used to define the parabolic curve should have been shown as:
X = a.Y² + c
Rather than:
Y = a.X² + c
This then gives:
a = [X2 – X1] / [Y2² – Y1²]
c = X1 – a.Y1²
S = ((X – c) / a) * Pi
Which provides the correct result.
Kind regards,
David
Thanks for the clarifications – everything makes sense now
.In summary:
Assuming that X is axial length and Y is radius, the equation used to define the parabolic curve should have been shown as:
X = a.Y² + c
Rather than:
Y = a.X² + c
This then gives:
a = [X2 – X1] / [Y2² – Y1²]
c = X1 – a.Y1²
S = ((X – c) / a) * Pi
Which provides the correct result.
Kind regards,
David
just a guy:
A very small spreadsheet is attached. All it does is calculate the csa at any point you specify along a conical segment.
Thanks Don. I can't look at it at the moment (no excel on this laptop) but I'm sure it's just what I need to accurately fold my Akabak horns.
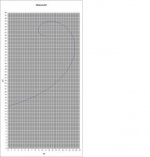
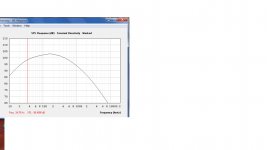
Ok, thats horn for 12 inch FR. One pic is resp image, another - xls built curve using exported file from resp, coordinates x nad y.
Both look quite different... Its a bit confusing to start extended woodworking with this)))
Both look quite different... Its a bit confusing to start extended woodworking with this)))
Attachments
Ok, I am quite gratefull to David for this FREE soft. At list I built a lot of labyrynths with it quite sucessfully, and conus horns also.
For JMLC - I am stuck on the midway. Also simulation of such 220Hz horn shows very smuth roll off to the low end.
Its pic with big volume of rear chamber, without acustic short circuit... Driver is a2 FR, with 95-96Db sensetivity
Even if will get the same curve but with lower SPL than resp shows - I will be still very happy)))
Attachments
Last edited:
Both look quite different...
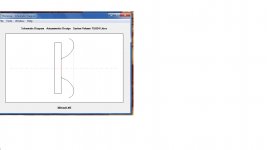
For LeCléac'h horns, Hornresp has the option to export an "exact profile", which uses an algorithm that is a little different than the original LeCleac'h algorithm, but it will give a horn that is closer to the profile the original algorithm tries to achieve. For simulations, Hornresp uses the original algorithm, and it is probably also used to draw the schematic. If you have answered yes to the question you get when exporting LeCléac'h horn data, you will get a curve that is slightly different from the schematic. If you answer no, you should get the exact representation of the schematic.
Attached is an attempt to illustrate that: I exported the horn data, imported it into excel, and pasted the excel graph on top of the hornresp schematic.
From what I can tell, you have used the "exact" option, since the other option does not extend the rollback further than what is shown in the schematic.
In any case, I would trust the exported data more than the schematic.
mwmkravchenko, have you experienced that there is a mismatch between the schematic and the exported data on a regular basis?
-Bjørn
Attachments
- Home
- Loudspeakers
- Subwoofers
- Hornresp