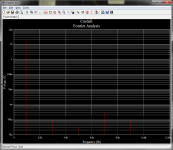
No more edit button so I'll have to bump. Here are the magnitude results:
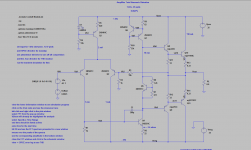
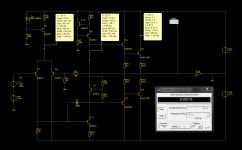
You'll also find an image of the schematic in action") I also found that this particular schematic behaves a bit erratically. When using the interactive simulation mode (picture 2) and letting it run, the THD would alternate between 0.002 and 0.003, predominantly being 0.003, regardless of timestep resolution.
I also found that this particular schematic behaves a bit erratically. When using the interactive simulation mode (picture 2) and letting it run, the THD would alternate between 0.002 and 0.003, predominantly being 0.003, regardless of timestep resolution.
Code:
Fourier analysis for $out:
DC component: 3.89269e-005
  No. Harmonics: 10, THD: 0.00322448 %, Gridsize: 256, Interpolation Degree: 1
Harmonic Frequency    Magnitude    Phase        Norm. Mag    Norm. Phase
-------- ---------    ---------    -----        ---------    -----------
 1       1000         19.968       -0.13168     1            0
 2       2000         0.000402738  -69.532      2.01691e-005 -69.4
 3       3000         0.000102638  -31.082      5.14011e-006 -30.95
 4       4000         0.000175408  150.85       8.78446e-006 150.982
 5       5000         3.0785e-005  -30.074      1.54171e-006 -29.942
 6       6000         0.000209934  113.57       1.05135e-005 113.702
 7       7000         0.000299694  44.1631      1.50087e-005 44.2948
 8       8000         0.000184869  57.811       9.25824e-006 57.9427
 9       9000         8.66966e-005 -0.68835     4.34177e-006 -0.55668
 10      10000        0.000185828  -98.169      9.30629e-006 -98.037
You'll also find an image of the schematic in action
I also found that this particular schematic behaves a bit erratically. When using the interactive simulation mode (picture 2) and letting it run, the THD would alternate between 0.002 and 0.003, predominantly being 0.003, regardless of timestep resolution.Attachments
Last edited:
Hello MagicBox
looks like your results align with the other simulators namely MC9 , LTspice, Pspice and Simetrix. From this it is fair to say that using the same models and circuit all of the above simulators should give similar THD simulations there are no huge differences.
Arthur
looks like your results align with the other simulators namely MC9 , LTspice, Pspice and Simetrix. From this it is fair to say that using the same models and circuit all of the above simulators should give similar THD simulations there are no huge differences.
Arthur
Yeah, I kept in line with 4ms - 8ms window, 4 periods. However, when I move around the window the THD varies, sometimes few more ppm, sometimes less. On average I'd say it's pretty close to the 0.0027 specified in the schematic. A shame the interactive meter doesn't show more digits, only 3 after the decimal point.
..................
On average I'd say it's pretty close to the 0.0027 specified in the schematic. A shame the interactive meter doesn't show more digits, only 3 after the decimal point.
Hi MagicBox,
Thanks for the sim. But what value we should add to the score list?
I'm reluctant to say 'between 0.002% - 0.003%' and prefer a more accurate figure, i.e. one more digit.
What about this (if you don't mind): repeat the sim with Vin=0.1V and R3=199k. Now you should get 0.026% (that's what MC says).
Divided by ten gives a reasonable estimate of the real value (from the original amp).
If no objections, we could add this value to the list (with the remark 'estimated').
Cheers,
E.
No problem, tomorrow I can update the results with your suggestion. Irregardless going by rounding and the erratic behaviour I'm pretty positive that the average sits somewhere around .0027 given the fluctuations and timespans of the 2 readings.
20KHz THD btw was around 0.500% if I remember correctly
Last edited:
I think we can conclude that the different simulation platforms are giving the same results when we are using perfect models and optimistic models (Cordell models).
It would be interesting if the same guys could run the same simulation using the factory models that I used. (Bob amp models)
Arthur has done it and he did get exactly the same results that I got, so we are missing LTspice, Multisim and MC.
An even more interesting thing to look at would be if someone could build the mentioned circuit and measure it.
A quick note about models;
What is a better model? Is that a model that gives lower THD, or is it a model that is more realistic?
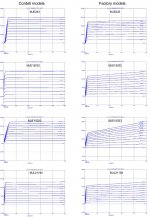
I have made plots of some of the Cordell models and compared them with factory models.
What do you think? (Hint: Jim Early)
BTW: I’m working on a new amp design, in my opinion it’s a lot more interesting to look at ways to lower distortion by designing new circuits instead of tweaking models.
This is what I’m getting when I'm using factory models. The phase margin is very good and there is no sign of oscillation. The circuit isn’t 100% optimised yet, so the final design will have lower distortion (in the simulator).
1K Full power:
Waveform Values
===============
F THD(HARM(V(LOAD))) IHD(HARM(V(LOAD)))
(Hz) (%) (%)
NA NA NA
1.000K 0.000 0.000
2.000K 4.516u 4.516u
3.000K 8.114u 6.742u
4.000K 8.120u 307.598n
5.000K 8.146u 642.329n
6.000K 8.146u 102.139n
7.000K 8.155u 375.882n
8.000K 8.155u 70.221n
9.000K 8.158u 206.201n
10.000K 8.158u 24.095n
20k Full power:
Waveform Values
===============
F THD(HARM(V(LOAD))) IHD(HARM(V(LOAD)))
(Hz) (%) (%)
NA NA NA
20.000K 0.000 0.000
40.000K 7.333u 7.333u
60.000K 25.364u 24.281u
80.000K 26.317u 7.018u
100.000K 26.416u 2.288u
120.000K 26.646u 3.493u
140.000K 28.717u 10.707u
160.000K 28.857u 2.835u
180.000K 29.942u 7.990u
200.000K 29.971u 1.306u
It would be interesting if the same guys could run the same simulation using the factory models that I used. (Bob amp models)
Arthur has done it and he did get exactly the same results that I got, so we are missing LTspice, Multisim and MC.
An even more interesting thing to look at would be if someone could build the mentioned circuit and measure it.
A quick note about models;
What is a better model? Is that a model that gives lower THD, or is it a model that is more realistic?
I have made plots of some of the Cordell models and compared them with factory models.
What do you think? (Hint: Jim Early)
BTW: I’m working on a new amp design, in my opinion it’s a lot more interesting to look at ways to lower distortion by designing new circuits instead of tweaking models.
This is what I’m getting when I'm using factory models. The phase margin is very good and there is no sign of oscillation. The circuit isn’t 100% optimised yet, so the final design will have lower distortion (in the simulator).
1K Full power:
Waveform Values
===============
F THD(HARM(V(LOAD))) IHD(HARM(V(LOAD)))
(Hz) (%) (%)
NA NA NA
1.000K 0.000 0.000
2.000K 4.516u 4.516u
3.000K 8.114u 6.742u
4.000K 8.120u 307.598n
5.000K 8.146u 642.329n
6.000K 8.146u 102.139n
7.000K 8.155u 375.882n
8.000K 8.155u 70.221n
9.000K 8.158u 206.201n
10.000K 8.158u 24.095n
20k Full power:
Waveform Values
===============
F THD(HARM(V(LOAD))) IHD(HARM(V(LOAD)))
(Hz) (%) (%)
NA NA NA
20.000K 0.000 0.000
40.000K 7.333u 7.333u
60.000K 25.364u 24.281u
80.000K 26.317u 7.018u
100.000K 26.416u 2.288u
120.000K 26.646u 3.493u
140.000K 28.717u 10.707u
160.000K 28.857u 2.835u
180.000K 29.942u 7.990u
200.000K 29.971u 1.306u
Attachments
Last edited:
THD Simulation
Hello Stinius
>> I think we can conclude that the different simulation platforms are giving the same results when we are using perfect models and optimistic models (Cordell models).
For my part I would say that I think we can conclude that the different simulation platforms are giving the same results when we are using "the same models" (Cordell models).
The purpose of the simulations was to prove a point about THD computations to Michael and that simulators do not hugely very in THD calculations .
I don't think these are perfect models and I know that output device modeling is especially bad at least with the models I have access to.
Can I ask you Stinius can you measure THD , and what version of Cadence Pspice are you using.
By the the way results you have posted what amplitude and load are they being simulated with.
Regards
Arthur
Last edited:
For my part I would say that I think we can conclude that the different simulation platforms are giving the same results when we are using "the same models" (Cordell models).
The purpose of the simulations was to prove a point about THD computations to Michael and that simulators do not hugely very in THD calculations
In my opinion, what was proved is that simulators can be adjusted (time steps, input levels, etc...) to provide about the same THD numbers, at least in the 25ppm range. I can't speak for others, but this was my early stance on this topic. I would expect this sort of simulator tool calibration work to be increasingly difficult while dealing with two orders of magnitude lower THD.
My second statement in the same post was about trusting the simulated absolute THD values. Assuming the tool calibration work was successfully completed and tested, obviously this boils down to the device models accuracy.
Finally, comparing the simulation results with measurements opens another can of worms; even assuming the (distributed) parasitic elements are well characterized, simulations may quickly run very complex and error prone. I maintain that, on the bench, distortions in the ppm range are decisively controlled by parasitics (like magnetic couplings between the class AB supply rails and the signal traces) rather than the intrinsic design performance. This makes the absolute THD calibration against experimental data extremely difficult.
Okay, with a 10 times lower input magnitude and increased gain I get ~0.026,
Thanks MagicBox.
Updated score list of Bob's amp:
Code:
Post:   Simulator:   THD1k:
3824    LTspice     26.5ppm
3826    Cadence    259.6ppm
3826    MicroCap    26.8ppm
3844    Cadence     81.8ppm
3850    Cadence    190.6ppm   (using bad models)
3863    Simetric   190.xppm   (using bad models)
3927    Simetrix    26.8ppm
3930    Cadence     26.9ppm
3930    Cadence      190ppm   (using bad models)
3949    Multisim     ~26ppm   (estimated)
@Stein,
Regarding Bob's models respectively factory (Modpex/ON/Motorola) models, I'm afraid both are not very realistic. The Early voltage (VAF) of most of bob's models are too high, while VAF of the Modpex models are too low. Have a look at the Modpex QMJE253, for instance: VAF=4.91894 (if it's true, the worst tranny ever made), while Bob's model says: VAF=310 (rather high, I would say).
The best you can do is just measure the Early voltage. If you need a high Early voltage, use a KSC3503/KSA1381. According to Glen's measurements these trannies do have an amazingly high VAF (700 resp. 400).
Cheers,
E.
Some summary thoughts on SPICE accuracy
I’m sorry I have not been present on this thread for awhile. I’ve been playing catch-up ball since RMAF and AES.
This has been a good discussion, and I want to thank Waly (post #3824) for getting the ball rolling by presenting his results. I also appreciate Edmond’s participation in showing what kind of positive results can be obtained. I also appreciate the involvement of all of the other participants. A lot of what I know about SPICE modeling and distortion sims is due to Andy C, and I wish he were here as well.
This all got started by one post claiming that SPICE had no value for distortion simulations. That same poster then posted that different simulators would give dramatically different results for distortion simulations of the same amplifier. Those are pretty strong statements and gross generalizations that don’t do anybody any good. Nevertheless, there is usually a grain of truth in such assertions and the lively discussion here has shown that there is such a grain of truth. Nothing is black and white, and more often is a matter of degree or is accompanied by caveats. One such caveat is that the person running the simulator knows how to use it optimally for distortion simulations. Nobody said that running accurate distortion simulations was easy or not requiring experience.
The amplifier of Figure 19.7 in my book that has been discussed here is essentially the same as the one of Figure 3.1. It is not a very good amplifier and indeed it was shown as the earliest step in the evolution of amplifiers in Chapter 3. It doesn’t include degeneration and isn’t anything I’d ever consider decent, but it serves as a good starting point for simulations, including distortion simulations.
Whether or not the simulator being used is being properly used for distortion simulations is an issue of concern that has been discussed here. Things like minimum time step are important. Sanity checks can easily be done to find out if one is getting reasonably expected results from a simulator by setting up a fundamental sinusoidal signal source and then doing an ideal add of two other sources at the second and third harmonic frequency, perhaps 80 and 120 dB down, respectively, and then running the sim for distortion. If you get bigger numbers than expected, maybe there is a problem with how the simulator is being used.
We depend a lot on the FFT to deliver our distortion results, but that is not the only way to get a distortion result. In fact, the FFT approach does not give us the real-time residual that we so often like to look at from a real distortion analyzer. SPICE lets us play this game too, simply by setting up a precise cancelation of the fundamental at the output of the amplifier. Yes, we must make multiple runs to precisely set the gain and phase of the cancellation path, but at the end of the day we have a great sanity check on the distortion results that we have obtained from the FFT approach. I frequently use such an approach when looking at the distortion of an output stage. See my Distortion Magnifier article in vol. 0 of linear audio. The concept is similar.
Reasonable transistor models are important for distortion simulations, especially if results will be compared across simulators. One should also sanity check the models in both simulators to verify that they perform the same in simple circuits that expose things like current gain, Early effect, etc. The models that can be found on my web site represent an attempt to have good models that have been checked by hand against the real-world devices and the datasheets. These models were created using LTspice, but should be verified for the same behavior in other simulators into which they have been installed. BTW, transistor models do not necessarily have to be complex and sophisticated to yield useful distortion results. Be very careful of MOSFET models, however.
Always be mindful that SPICE complies with the “garbage in, garbage out” paradigm. It cannot be accurate for things that it does not model. This is where many discrepancies with the real world come in, especially when simulating very low values of distortion. Magnetic coupling distortion comes to mind. Failure to model stray inductances comes to mind (especially in regard to stability of output Triples). And finally, bear in mind that we often use ideal voltage sources for the rails in our simulations! Don’t blame the simulator if you don’t model these and they turn out to be significant sources of distortion in the real amplifier.
What are our reasonable expectations? I’d say I’m happy to be within a factor of two on THD at levels of 0.001%. Simulated THD is very valuable for RELATIVE comparisons that result from circuit changes and improvements. Moreover, they are also useful in the absolute sense in a different way. They set the bar for reasonable expectations. If you simulate an amplifier and get 0.01% and then build it and get 0.05%, you have probably screwed up the implementation in the real world and SPICE has given you a good red flag.
Similarly, if you simulate 0.01% in one simulator and get 0.05% in another, that is a red flag also.
Before we even compare distortion simulations across simulators, we need to do detailed spot comparisons of operating points, frequency response, etc on the amplifier across the simulators. This can be very helpful in pointing out if there is a mistake or if the models are misbehaving in one of the simulators. It is not asking a lot that the node voltages and base currents and closed loop frequency response be nearly identical across the simulators. Do the square wave responses look the same? Has the quiescent bias in the output stage been carefully adjusted to be the same in the two simulations? If significant adjustment of the bias spreader was needed to achieve that, why so? The list goes on.
Another potential real-world issue that is often not modeled in the simulation is differences among instantiations of the same transistor. In SPICE, they are identical unless you take measure to make them different. This might be an issue in a differential pair, for example. How sensitive is your amplifier to such mismatches? Try different device selections in the two sides of a differential pair and see what you get.
The amplifier in Figures 19.7 and 3.1 is essentially the same design, and yet I quoted substantially higher 1kHz THD in connection with Figure 3.1 in the book as opposed to the much lower number that the example simulation on my web site. This points out how very important transistor models are. Some of the models in these two exercises were different, and my results suffered the consequences. It turns out that I was too trusting of the MJE243/4 models when I authored that part of the book back in 2008. It turns out those models were absolutely terrible. If the Cordell models posted on my website are used for the Figure 3.1 simulation, the much lower distortion levels will be realized. A close look at the MJE243/4 models shows ridiculously low Early voltage. It is a perfect example of how terrible and untrustworthy most manufacturer’s models are. I have long been mindful of the shortcomings of available models and even then I was fooled back in 2008. So if you want to say that SPICE can be misleading without great diligence in regard to details like models, I must agree.
Cheers,
Bob
ex_Krell Dan d'Agostino has developed his Momentum amp which is said to have local error correction circuits on the 24-output_transistor stage, and global feedback between the input and VAS stages. The output transistors are said to be matched to 0.1% uniformity. A LTSpice sim of just the output stage shows about 0.01% THD@20Khz with 300 watts into 8ohms.
What type of output stage error correction circuit would yield significantly lower THD on a 24-32 output transistor stage? The textbook Hawksford EC provides only modest THD improvement.
What type of output stage error correction circuit would yield significantly lower THD on a 24-32 output transistor stage? The textbook Hawksford EC provides only modest THD improvement.
Ltspice fundamental null automation
you might want to try:
http://www.diyaudio.com/forums/software-tools/101810-spice-simulation-37.html#post1333137
...
We depend a lot on the FFT to deliver our distortion results, but that is not the only way to get a distortion result. In fact, the FFT approach does not give us the real-time residual that we so often like to look at from a real distortion analyzer. SPICE lets us play this game too, simply by setting up a precise cancelation of the fundamental at the output of the amplifier. Yes, we must make multiple runs to precisely set the gain and phase of the cancellation path, but at the end of the day we have a great sanity check on the distortion results that we have obtained from the FFT approach. I frequently use such an approach when looking at the distortion of an output stage. See my Distortion Magnifier article in vol. 0 of linear audio. The concept is similar.
you might want to try:
http://www.diyaudio.com/forums/software-tools/101810-spice-simulation-37.html#post1333137
NICE!
Distortion residual
Very clever,
[nit pick on]
though MC does it even more 'automatically'. Just plot RES(V(out))
[nit pick off]
Cheers,
E.
Very clever,
[nit pick on]
though MC does it even more 'automatically'. Just plot RES(V(out))
[nit pick off]
Cheers,
E.
VAF=4.91894
Hi Bob,
Nice to see you back. As for Modpex models, I've decided not to use them anyhow.
Instead, I prefer (for example) Fairchild, Philips and Zetex models which seem to be far more reliable.
BTW, Modpex (=Motorola=ON) models are automatically (read: brainlessly) generated, hence ridiculous parameters like VAF=4.91894
Cheers,
E.
[snip]
The amplifier in Figures 19.7 and 3.1 is essentially the same design, and yet A close look at the MJE243/4 models shows ridiculously low Early voltage. It is a perfect example of how terrible and untrustworthy most manufacturer’s models are. I have long been mindful of the shortcomings of available models and even then I was fooled back in 2008. So if you want to say that SPICE can be misleading without great diligence in regard to details like models, I must agree.
Cheers,
Bob
Hi Bob,
Nice to see you back. As for Modpex models, I've decided not to use them anyhow.
Instead, I prefer (for example) Fairchild, Philips and Zetex models which seem to be far more reliable.
BTW, Modpex (=Motorola=ON) models are automatically (read: brainlessly) generated, hence ridiculous parameters like VAF=4.91894
Cheers,
E.
I think we can conclude that the different simulation platforms are giving the same results when we are using perfect models and optimistic models (Cordell models).
Hi Stinius,
I'm afraid I have to take strong exception to your assertion that my models are optimistic. It is nice that you plotted the output characteristics of my models against those of some factory models. The factory models do indeed look more realistic (although they don't look as terrible as the one I used, where current gain literally doubled when Vce went from 2V to 20V).
My models come from hours of tedious measurements on REAL devices which were then checked against LTspice simulations of those models. They are not optimistic; they are a reasonable reflection of what you get when you use a real device, recognizing that there is significant variation of real devices, particularly among different manufacturers whose processes differ.
I was indeed surprized at the flatness of the collector characteristic of the MJE243, as I had also been under the impression that it was not so good.
One needs to realize that Early effect measurements can be prone to error if not done very carefully. Since moderate voltages and moderate collector currents are encountered in the measurement, it is very easy for heating of the device to influence beta and result in an Early voltage that is too low. The measurements must be done very quickly, often with the device on a heat sink, to avoid this problem. Such errors go in the opposite direction to what you believe are the errors in my models.
For the MJE243, I measured collector current at Vce of 10V and 30V for a given base current, where collector current was 10mA at 10V. At 30V, collector current had risen to only 10.17mA.
I would expect and hope that manufacturers use pulsed testing with adequately short pulses to avoid this source of error, but perhaps they do not always do so when formulating their models.
Also bear in mind that it is not unusual for VA to be twice or even significantly more than that of the rated collector breakdown voltage.
In making models, it is also important to start with reasonable numbers, rather than allowing a computer program to start in some other way and perhaps land in a local optimum with crazy numbers. I start with VA = 2X breakdown voltage, do much of the rest of the model, then alter VA to obtain the collector current slope that corresponds to real measurements, then iterate. Alternatively, I'll hand-calculate VA from the electrical measurements and use that as the starting point.
Just because my models yielded significantly lower distortion than the terrible manufacturer's models does not mean that my models are optimistic.
If you can, I encourage you to try carefully some of these measurements yourself, but they are not easy. Also, if you think that there is something wrong with the procedures I outline for modeling in Chapter 21 of my book, please let me know.
BTW, it is a misnomer that "high" voltages need to be used to measure VA. I never used voltages in excess of 50V. Indeed, as I mentioned above, the use of high voltages is actually undesirable, as the resulting junction dissipation can lead to erroneous results due to beta dependence on junction temperature.
In closing, let me say once again that I, too, was surprized at how "good" the VA was for the MJE243 when I actually measured it.
Cheers,
Bob
- Home
- Amplifiers
- Solid State
- Bob Cordell Interview: Error Correction