How do you figure that out or could you explain how in the audio press so called amplifiers with non decending harmonic spectrums or even worse predominant 3rd harmonic spectrum ...
I can not...
I did not hear them,
but only read...

all I heard and sounded good were with relatively high THD
but had descending harmonic distribution.
why?I will not mention who as some dont like to be mentioned here.
Do you have some commercial interest to protect?
I would like to ask the Membership this question:
Does keeping anonymous, the name of manufacturers, provide a service to the Forum or the opposite, A Disservice to the Membership?
Hello Edmond
Dont get me wrong I don't think you need Spectre to simulate low THD amplifier designs you have proven that numerous times.
I was just repeating things I have heard about supposedly high performance simulators.
Just one question your amp is composed of current controlled current sources , is this correct.
Regards
Arthur
I can not...
I did not hear them,
but only read...
all I heard and sounded good were with relatively high THD
but had descending harmonic distribution.
I have listened to a few of these "out of conventional wisdom amps" and they are as good as the reviewers say, that still keeps me in the dark regarding which way to go and to the relevance of harmonic spectrum. What I see in all cases is that low order harmonics especially from 6th and up are in all cases very low where the amps were well regarded be they low or hi THD. I find it a bit harder to achieve the high THD low low order harmonics type harder to achieve. Another curious factor I see strangely enough is age, most older folk (+40) prefer the high THD, high 2nd harmonic amps and vice versa.
As a example amp try getting a copy of absolute sound from september 2011.
Sorry for the offtopic but lets get back to the significance of sim results, its most interesting and educational.
why?
Do you have some commercial interest to protect?
I would like to ask the Membership this question:
Does keeping anonymous, the name of manufacturers, provide a service to the Forum or the opposite, A Disservice to the Membership?
Yes, more than one. Most revievers dont like to be brought into controversial issues like these as they dont really have the answers either.
Andrew after you tire of recieving hate mail and supposed court action which is laughable at times for you opinion regarding "snake oil" and "distorted and wrongful electronic principles" type advertising and philosophy from manufacturers and others you rather tend to keep certain elements anonymous.

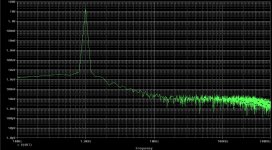
PSpice, about -200dB (full output is 20V, to stay consistent with the rest).
To reach the above value I had to change again the max time step and look for an optimum. This optimum is now different ( much smaller, 10mS/(2^20-1) ) than the previous ( used for the 19.7 amp simulation, 10mS/(2^17-1) ). Using this new max step in the 19.7 amp simulation (with discrete components) leads to some 200ppm distortion (double the optimum, and about x8 the LTSPICE distortions value).
To reach the above value I had to change again the max time step and look for an optimum. This optimum is now different ( much smaller, 10mS/(2^20-1) ) than the previous ( used for the 19.7 amp simulation, 10mS/(2^17-1) ). Using this new max step in the 19.7 amp simulation (with discrete components) leads to some 200ppm distortion (double the optimum, and about x8 the LTSPICE distortions value).
Attachments
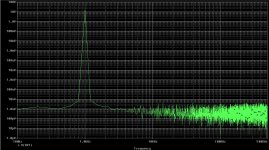
This is what I get if I use in the synthetic 19.7 amp (with VCCSs) the same max time step as in the optimum found in post #3884.
Clearly much worse, although this time step provided a (relative) minimum distortion result, for the 19.7 amp with discrete components.
Clearly much worse, although this time step provided a (relative) minimum distortion result, for the 19.7 amp with discrete components.
Attachments
Thanks Walter.
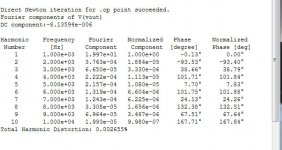
So the FFT stuff itself seems alright. No extreme rounding errors, even when the simulator is 'teased' with bunch of components.
Nevertheless we see an enormous discrepancy between THDs of the original 19.7 amp.
Why?!
Regarding which simulator gives the most plausible figures, see post 3771
(and draw your own conclusions)
Cheers,
E.
Regarding which simulator gives the most plausible figures, see post 3771
(and draw your own conclusions)
I already did; sorry, I don't buy this kind of "proof". At least because it implies the models used in simulation match within the same error range the physical devices. Which is already widely known as untrue, unless you have a different source of device models than everybody else.
The other way around, choose a reasonable complex circuit, simulate it at your best, publish the results, then build it yourself or wait somebody to do it and confirm by measurements the simulation results. Do this for a number of topologies and, if successfull, then you may buy yourself some confidence in your simulator and device models.
In my opinion, absolute value distortion simulations with stock models are good up to a 0.01% ballpark, anything beyond that is a random number that may or may not fit the reality. Relative distortion simulation is though a very good method of investigating a certain circuit/topology properties.
I already did; sorry, I don't buy this kind of "proof". At least because it implies the models used in simulation match within the same error range the physical devices. Which is already widely known as untrue, unless you have a different source of device models than everybody else.
I'm sorry, but I can't follow your reasoning. Perhaps you can say it in a different way.
The other way around, choose a reasonable complex circuit, simulate it at your best, publish the results, then build it yourself or wait somebody to do it and confirm by measurements the simulation results. Do this for a number of topologies and, if successfull, then you may buy yourself some confidence in your simulator and device models.
We did that already. See the PGP project.
Simmed THD-20k = 0.486ppm
Measured THD-20k = ~0.5ppm
(100W into 4 Ohms; BW = 100kHz)
In my opinion, absolute value distortion simulations with stock models are good up to a 0.01% ballpark, anything beyond that is a random number that may or may not fit the reality.
It's true that nonlinearities of BJTs and MOSFETs are generally not well modeled. Suppose that they deviate by 10%. That means (roughly) that the THD figures will also deviate from the real values by 10%. So if the sim say 1ppm then the real figure will be 1.1ppm. So where does this "0.01% ballpark" come from? From your own experience, from literature? Please elaborate.
Relative distortion simulation is though a very good method of investigating a certain circuit/topology properties.
Absolutely.
It's true that nonlinearities of BJTs and MOSFETs are generally not well modeled. Suppose that they deviate by 10%. That means (roughly) that the THD figures will also deviate from the real values by 10%.
Wishful thinking. Consider exponential (BJT), or best case squared (FET) dependency variations.
So where does this "0.01% ballpark" come from? From your own experience, from literature? Please elaborate.
Both. Sorry, I can't share confidential documentation from Europractice, but know that device level simulation was abandoned for quite some time in the industry, reason being (beyond the complexity of circuits) exactly the difficulties to include precise models in Spice. It's not about extracting the right prameters, but about the Spice model templates, that do not include anything beyond the very basics (for example the FET subthreshold conduction, or the BJT base current crowding effects, both major sources of distortions). Anything I've seen is modelled at the macrocell level (like the distortions of certain topology of a mosfet opamp) and guaranteed within certain limits. We then use Monte Carlo to identify the worst case conditions.
I've build my fair share of audio power amps (nothing extra fancy though) and whatever simulation was showing (down and under 0.0010%) never got anything under 0.0050% - while keeping decent and practically safe stability margins. Hence my comment about 19.7 - if that's a topology providing 25ppm of distortion, then everybody from audio DIYers to the audio pros can safely commit seppuku. Look at this sophisticated power amp, it is specified at 0.005% (twice the 19.7 simulated number, into 8 ohm, at slightly larger power though) and measures about the same.
>Sorry, I can't share confidential documentation from Europractice
That's very helpful.
>the Spice model templates, that do not include anything beyond the very basics (for example the FET subthreshold conduction...
Clearly you underestimate me. Here, at this forum, I was the first one who simulated the sub-threshold conduction of MOSFETs. Look here and further on.
>Look at this sophisticated power amp
Since when are people who produce fancy audiophile stuff are supposed to set benchmarks?
Sorry Walter, but I'm waiting for better arguments.
Cheers,
E.
edit: >Consider exponential (BJT).... dependency variations.
So what? It's already highly nonlinear (as nonlinear as you can get). So it has hardly any further impact on THD figures.
Last edited:
>
Sorry Walter, but I'm waiting for better arguments.
Sorry, don't, that's all I have. Good luck and happy simulations!
I've just run some comparisons between LTspice and Cadence Pspice using a polynomial for distortion and a 1KHz sinewave primarily so that I can calculate the expected results (very simplified first step).
My post got too long so I've just put it into a word file and attached it.
First I am not very experienced with FFT's and have no experience with .Four or with LTspice, so don't feel obliged to open the attachment.
The attachment contains only text describing the test and my observations no great work here, the data can be supplied if there is any interest.
My observations where basically that I found Cadence (Cad) to be at least a lot more fussy. LTspice matched my expected results for all cases tried.
In the end I was somewhat comfortable with the Cad .Four results if adjusted properly (and waited for the results). I was not able to get satisfactory results for the Cad. FFT plots however.
The FFT plots and .Four data appear to be decoupled and using one to "tune" the other may not actually provide any benefit.
Reminder that given my lack of experience with these functions this most likely means operator error rather than any SW deficiencies.
Thanks
-Antonio
Attachments
Hi Antonio,
Thanks for your input. Very useful.
Most likely you have nailed down why some simulators produce just noise.
What's exactly going on I don't know, as I can't look under the hood of these simulators, but it reminds me of similar issues I had when writing S/W for a PC-based distortion analyzer.
The point is that we are dealing here with sampled data which probably need to be re-sampled in order to get 2^N equidistant samples for an FFT. If you do this the sloppy way (for example by means of piece-wise linear interpolation) you will get excessive noise.
>Reminder that given my lack of experience with these functions this most likely means operator error rather than any SW deficiencies.
Apparently you're not the only one (see Arthur, Mike & Walter). If anybody else also makes these so called 'operator errors' and/or if they are hardly to avoid, then we may safely consider it as a S/W deficiency. Decent S/W should take care of such matters.
Last but not least, I would ask you what happens when you put the output from LTspice (see below) by means of 10 separate sine sources (and summed together, of course) as input for the Cadence simulator. Normally, one should get THD=26.55ppm again. But in this case perhaps 200ppm or so?
Cheers,
E.
Attachments
Last edited:
- Home
- Amplifiers
- Solid State
- Bob Cordell Interview: Error Correction