While trying to get a better idea what kind of distortions occur in a simulated amp I found an interesting way to present the signals.
Basically, you take the output of the amp, reduce its amplitude by gain to match that of input signal, subtract. Now feed the the result to the Y-axis of "scope" and the input signal to the X-axis of scope.
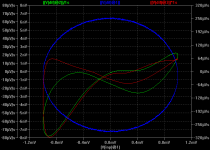
Ideal linear amp with zero latency must show a straight line. Real amp has propagation delay, that is ideally constant wrt input signal, and this must with sinusoidal input manifest as a perfect ellipse on the scope (wrapped sinewave). By stepping through few input amplitudes, and superimposing outputs of such graphs after normalizing, we expose the deviations from the ideal *shape* of the signal. It is visually very easy to see, and imo even gives very useful hints as to what is going on in the amp.
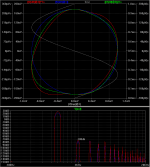
See the graphs below. In this case, graph is made for outputs of 50uW (THD 0.000006%), 55W (THD 0.0014%) and 178W (THD 0.0012%). THD of first 9 harmonics. Notice that THD calculation shows slightly lower THD for 178W output wrt to 55W output.
Look at the graphs. Blue is reference, 50uW output with lowest THD. Green is 55W output and red is 178W output. All graphs are zoomed suitably to approximate circle shape. Absolute values of graphs are meaningless, its only shape that matters here. It is immediately evident that 55W and 178W output graphs deviate very seriously from ideal circle, despite that total THD was 0.001% for both.
How to read the graphs. X-axis shows input voltage instead of time axis. Timing is hidden. As input sinewave develops in time, output signals circulate on this graph, rotating counterclockwise. There are 9 full circles of sinewaves, and they are there behind each other.
When input signal goes from zero to positive slope, watch output response in south-east sector. When input signal wraps from its positive peak and goes down towards zero, watch north-east sector, etc. Because output lags input, difference is initially negative (we start saving after 1st period), later when input goes down, difference becomes positive. Time is shown as signal on graph, just to help visualize how input signal is changing wrt time. Its not any kind of timing reference there.
Nothing quantitative can be drawn from such graphs, but only relative *shapes* of the signals can be compared. We know for sure that for sinusoidal input, ideal shape would be exactly circle or ellipse. Any deviation from that is distortion.
In this particular NFB amp simulation, it can be easily seen that positive going half of the 55W waveform oscillates around reference "ideal" (NFB in action?), and that the amp is asymmetric - negative slope is pretty nasty.
178W output shows more severe overcompensation, probably due to NFB lag and arising late compensation. In both high power cases negative slope on first glance seems to lead input, but I suspect it is late "catching up" due to NFB action (exact timing is lost on this graph).
Also note, that THD calculation gave 178W output lower THD than for 55W output. Its not because the distortion was lower, but only because nature of it was slightly different (less higher order harmonics due to evident slew rate limiting).
Because we are graphing *difference* between input and output, our sensitivity is pretty large, canceling out absolute output levels.
In conclusion, it seems to me that this kind of graph is exposing some details very hard to notice by any other means. I'd like to think that this helps to understand the nature of distortion, and perhaps even shed some light on how non-NFB amps differ from NFB amps.
Comments? Anyone used such graphing before and how its actually called?
Basically, you take the output of the amp, reduce its amplitude by gain to match that of input signal, subtract. Now feed the the result to the Y-axis of "scope" and the input signal to the X-axis of scope.
Ideal linear amp with zero latency must show a straight line. Real amp has propagation delay, that is ideally constant wrt input signal, and this must with sinusoidal input manifest as a perfect ellipse on the scope (wrapped sinewave). By stepping through few input amplitudes, and superimposing outputs of such graphs after normalizing, we expose the deviations from the ideal *shape* of the signal. It is visually very easy to see, and imo even gives very useful hints as to what is going on in the amp.
See the graphs below. In this case, graph is made for outputs of 50uW (THD 0.000006%), 55W (THD 0.0014%) and 178W (THD 0.0012%). THD of first 9 harmonics. Notice that THD calculation shows slightly lower THD for 178W output wrt to 55W output.
Look at the graphs. Blue is reference, 50uW output with lowest THD. Green is 55W output and red is 178W output. All graphs are zoomed suitably to approximate circle shape. Absolute values of graphs are meaningless, its only shape that matters here. It is immediately evident that 55W and 178W output graphs deviate very seriously from ideal circle, despite that total THD was 0.001% for both.
How to read the graphs. X-axis shows input voltage instead of time axis. Timing is hidden. As input sinewave develops in time, output signals circulate on this graph, rotating counterclockwise. There are 9 full circles of sinewaves, and they are there behind each other.
When input signal goes from zero to positive slope, watch output response in south-east sector. When input signal wraps from its positive peak and goes down towards zero, watch north-east sector, etc. Because output lags input, difference is initially negative (we start saving after 1st period), later when input goes down, difference becomes positive. Time is shown as signal on graph, just to help visualize how input signal is changing wrt time. Its not any kind of timing reference there.
Nothing quantitative can be drawn from such graphs, but only relative *shapes* of the signals can be compared. We know for sure that for sinusoidal input, ideal shape would be exactly circle or ellipse. Any deviation from that is distortion.
In this particular NFB amp simulation, it can be easily seen that positive going half of the 55W waveform oscillates around reference "ideal" (NFB in action?), and that the amp is asymmetric - negative slope is pretty nasty.
178W output shows more severe overcompensation, probably due to NFB lag and arising late compensation. In both high power cases negative slope on first glance seems to lead input, but I suspect it is late "catching up" due to NFB action (exact timing is lost on this graph).
Also note, that THD calculation gave 178W output lower THD than for 55W output. Its not because the distortion was lower, but only because nature of it was slightly different (less higher order harmonics due to evident slew rate limiting).
Because we are graphing *difference* between input and output, our sensitivity is pretty large, canceling out absolute output levels.
In conclusion, it seems to me that this kind of graph is exposing some details very hard to notice by any other means. I'd like to think that this helps to understand the nature of distortion, and perhaps even shed some light on how non-NFB amps differ from NFB amps.
Comments? Anyone used such graphing before and how its actually called?
Attachments
Hi Wimms.
Your graphical representation clearly shows that the amplifier under test is not internally balanced, but are these measurements taken using a resistor load that ideally matches zero current crossover activity with the negligible power demand of zero voltage crossover ?
If yes you are not invoking the loudspeaker back-emf induced distortions that alter the sonic character of reproduction, and which will generate different diagonally opposite phase shifted wiggles.
Also can I suggest you study at 10kHz, because any half decent amplifier is okay at 1kHz.
Would it not be possible to zero null your input reference to match output before subtraction so that you end up with more of a straight line with +/- deviations ?
Unfortunately this would apply only for that given amplitude and frequency, for the phase shift changes with frequency, and the propagation delay with amplitude, the latter being impossible to observe by monitoring resistor/sine thd figures in output isolation with continuous sine wave drive !!!!!
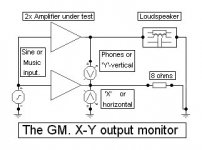
This is why I have simulated use of my suggested X-Y monitor circuit, where when you use two amplifiers, both have the same nominal propagation delay to whatever input is applied..
Then any ovality will represent time and voltage shifted error arising at the loudspeaker terminals wrt that arising across a perfect resistor; ie; the display will show unwanted zero phase amplitude based as well as back-emf induced non-linearities.
Ovality = amplifier impedance. Shows back-emf induced time fuzzing of loudspeaker voltage !
Straight line = perfectly resistive.
Voltage errors = amplitude non-linearity, crossover distortion, slew rate limit induced error, voltage/current clipping etc.
This display could be observed in real time with sine or music input, just watch that scope is isolated.
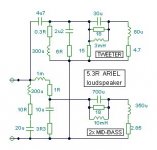
I will also attach approximate virtual equivalent of the well known 'Ariel' loudspeaker that is nicely awkward to drive at 10kHz but sounds excellent with a good amplifier; usually tube types. Sine display gives time expansion at centre of horizontal axis. The first four half cycle sinewave currents with this loudspeaker are quite different at 10kHz !!!!!
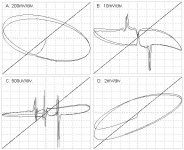
And finish off with four two 10kHz cycle X-Y / Ariel simulations with +/- 10V peak at the output terminal. (Which will always be more idealistic than real life)
A = D Self 'Blameless' like circuit showing effect of resistor damped series output inductance. (Loss of image accuracy)
B = same amplifier without choke. (C.dom causing amplifier impedance + degrading crossover suppression )
C = ditto but without 'C.dom' as well. (Phase shifted/back emf induced class-AB crossover still not gone with approx 80dB nfb)
D = my 25W class-A. (Not perfect, but excellent to listen to)
Cheers ............. Graham.
Your graphical representation clearly shows that the amplifier under test is not internally balanced, but are these measurements taken using a resistor load that ideally matches zero current crossover activity with the negligible power demand of zero voltage crossover ?
If yes you are not invoking the loudspeaker back-emf induced distortions that alter the sonic character of reproduction, and which will generate different diagonally opposite phase shifted wiggles.
Also can I suggest you study at 10kHz, because any half decent amplifier is okay at 1kHz.
Would it not be possible to zero null your input reference to match output before subtraction so that you end up with more of a straight line with +/- deviations ?
Unfortunately this would apply only for that given amplitude and frequency, for the phase shift changes with frequency, and the propagation delay with amplitude, the latter being impossible to observe by monitoring resistor/sine thd figures in output isolation with continuous sine wave drive !!!!!
This is why I have simulated use of my suggested X-Y monitor circuit, where when you use two amplifiers, both have the same nominal propagation delay to whatever input is applied..
Then any ovality will represent time and voltage shifted error arising at the loudspeaker terminals wrt that arising across a perfect resistor; ie; the display will show unwanted zero phase amplitude based as well as back-emf induced non-linearities.
Ovality = amplifier impedance. Shows back-emf induced time fuzzing of loudspeaker voltage !
Straight line = perfectly resistive.
Voltage errors = amplitude non-linearity, crossover distortion, slew rate limit induced error, voltage/current clipping etc.
This display could be observed in real time with sine or music input, just watch that scope is isolated.
I will also attach approximate virtual equivalent of the well known 'Ariel' loudspeaker that is nicely awkward to drive at 10kHz but sounds excellent with a good amplifier; usually tube types. Sine display gives time expansion at centre of horizontal axis. The first four half cycle sinewave currents with this loudspeaker are quite different at 10kHz !!!!!
And finish off with four two 10kHz cycle X-Y / Ariel simulations with +/- 10V peak at the output terminal. (Which will always be more idealistic than real life)
A = D Self 'Blameless' like circuit showing effect of resistor damped series output inductance. (Loss of image accuracy)
B = same amplifier without choke. (C.dom causing amplifier impedance + degrading crossover suppression )
C = ditto but without 'C.dom' as well. (Phase shifted/back emf induced class-AB crossover still not gone with approx 80dB nfb)
D = my 25W class-A. (Not perfect, but excellent to listen to)
Cheers ............. Graham.
Attachments
hi Graham,
thanks for your interesting reply.
In my view it is rather impossible to perform a null test with reactive load. Perfectly normal phase shifts stick out too much, and it is rather difficult to account for what is normal and what is not.
The same delay dependence on amplitude with reactive load is in my view pretty normal thing to happen.
I understand that you are much more interested in amp-speaker interaction, thats what your method seems to try to expose. but wouldn't it be more correct to compare ideal amp into speakerload with DUT into speakerload? At least in simulations. Ideal amp would have to have roughly similar phase response as DUT though.
That straight line in your test. This is what my sim above zooms into. Its not so straight at all.
I've tried speakerloads with bandwidth limited squarewave (composed from 20 harmonic sinewave generators) with simulated amps before (though not with this method), and it very well shows how stored back-emf energy forces output stage to crossover currents upto several times after voltage crosses zero without voltage errors actually developing. Very interesting to observe - you realize that during these moments NFB is completely detached and amp output impedance is doing crazy dancing on its own.
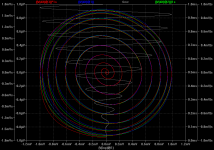
In my case the speakerload is not wanted. It actually makes it harder to observe amp nonlinearities. The phase shift is unavoidable, especially if we use most convenient pure sinewave test signal. To use speakerload, I'd have to use the raised cosine windowed test signal, and it produces spirals instead of ovals. Becomes pretty cluttered there. I'll attach an example graph. It isn't really much different from what I learned with resistive load.
thanks for your interesting reply.
Yes, that was resistive load. My surprise was actually that the method so well exposes intrinsical nonlinearity of the amp into resistive load and at 1khz where it should be easy job for the amp. Remember, highest harmonics was 100db(!) down the 177W test signal. I didn't really expect to be able to see the nature of the distortion so clearly. THD plot is pretty useless in comparison. And even normal timebased subtracted error voltage is less striking.Graham Maynard said:Your graphical representation clearly shows that the amplifier under test is not internally balanced, but are these measurements taken using a resistor load that ideally matches zero current crossover activity with the negligible power demand of zero voltage crossover?
If yes you are not invoking the loudspeaker back-emf induced distortions that alter the sonic character of reproduction, and which will generate different diagonally opposite phase shifted wiggles.
Also can I suggest you study at 10kHz, because any half decent amplifier is okay at 1kHz.
You mean to imitate ideal amp with matched prop delay of the DUT? It is possible, though difficult. But the result is much harder to interpret. See attach. Note that reference blue is basically straight line, its just so much zoomed into (1nV/div) that it appears as oval. There, nonlinearity errors of higher power signals exceed in magnitude of normal prop delay induced voltage, and it becomes hard to correlate with the signal. Imo slight suitable phase shift before subtraction actually helps to understand the result. Its about balance, too much, and you'll see nice ovals only.Would it not be possible to zero null your input reference to match output before subtraction so that you end up with more of a straight line with +/- deviations ?
Agree on the first part, but I'm not sure I follow you on the second part.Unfortunately this would apply only for that given amplitude and frequency, for the phase shift changes with frequency, and the propagation delay with amplitude, the latter being impossible to observe by monitoring resistor/sine thd figures in output isolation with continuous sine wave drive !!!!!
In my view it is rather impossible to perform a null test with reactive load. Perfectly normal phase shifts stick out too much, and it is rather difficult to account for what is normal and what is not.
The same delay dependence on amplitude with reactive load is in my view pretty normal thing to happen.
No doubt this is very interesting approach, and perhaps even easier to conduct in real life. But I think this is cancelling out several amp nonlinearities (if they are perfect match), and exposes only effects that becomes visible thanks to reactance of speaker.This is why I have simulated use of my suggested X-Y monitor circuit, where when you use two amplifiers, both have the same nominal propagation delay to whatever input is applied..
I understand that you are much more interested in amp-speaker interaction, thats what your method seems to try to expose. but wouldn't it be more correct to compare ideal amp into speakerload with DUT into speakerload? At least in simulations. Ideal amp would have to have roughly similar phase response as DUT though.
Interesting. I may be wrong, but I interpret differently. Ovality that appears when you compare resistive load with reactive load is in my view reactance of the speaker, time shift between current and voltage. I don't see this as impedance of amp, although nonzero impedance of amp allows us to see that. Back-emf is not necessarily real there. Time fuzzying shouldn't happen for sinusoidal signals. This hints that you used discontinuous test signal, like positive half of sine starting right from zero. This is like impulse that causes some oscillation, and that is what manifests as time fuzzying. It occurs in sim too. To make "clean" test, you'd want to use AM modulated sinewave that rises smoothly (and cosinusoidally) from zero. Imo that kind of time fuzzying disappears then.Then any ovality will represent time and voltage shifted error arising at the loudspeaker terminals wrt that arising across a perfect resistor; ie; the display will show unwanted zero phase amplitude based as well as back-emf induced non-linearities.
Ovality = amplifier impedance. Shows back-emf induced time fuzzing of loudspeaker voltage !
Straight line = perfectly resistive.
Voltage errors = amplitude non-linearity, crossover distortion, slew rate limit induced error, voltage/current clipping etc.
That straight line in your test. This is what my sim above zooms into. Its not so straight at all.
If you simulate with sinewaves starting from 0 volts, then this is wrong. Not only first 4 cycles are different, but theoretically all of them. Sim assumes all currents and voltages to be zero at time0. It is unrealistic increase of amplitude. You get impulse response of the bw-limited amp-speaker system superimposed with the test signal.'Ariel' loudspeaker..
Sine display gives time expansion at centre of horizontal axis. The first four half cycle sinewave currents with this loudspeaker are quite different at 10kHz !!!!!
I've tried speakerloads with bandwidth limited squarewave (composed from 20 harmonic sinewave generators) with simulated amps before (though not with this method), and it very well shows how stored back-emf energy forces output stage to crossover currents upto several times after voltage crosses zero without voltage errors actually developing. Very interesting to observe - you realize that during these moments NFB is completely detached and amp output impedance is doing crazy dancing on its own.
In my case the speakerload is not wanted. It actually makes it harder to observe amp nonlinearities. The phase shift is unavoidable, especially if we use most convenient pure sinewave test signal. To use speakerload, I'd have to use the raised cosine windowed test signal, and it produces spirals instead of ovals. Becomes pretty cluttered there. I'll attach an example graph. It isn't really much different from what I learned with resistive load.
Very interesting graphs. It is evident though that you indeed use sinewave starting with rectangular windowing. I'd distrust the fuzzying part and also compare only general shapes of these graphs. Of course, the crossover distortion spikes are pretty striking. Though, when you look at the scope divisions, then despite awful shape in graph C, it must be admitted that this amp is showing *least* of error voltage. This only underlines that phase shift is causing "static" error that hides the details and should be ideally canceled to a reasonable degree.A = D Self 'Blameless' like circuit showing effect of resistor damped series output inductance. (Loss of image accuracy)
B = same amplifier without choke. (C.dom causing amplifier impedance + degrading crossover suppression )
C = ditto but without 'C.dom' as well. (Phase shifted/back emf induced class-AB crossover still not gone with approx 80dB nfb)
D = my 25W class-A. (Not perfect, but excellent to listen to)
Attachments
Hi Wimms.
Nice to be able to chat with you about this, even though in public.
You wrote agreed first - not second. Amplifiers quite literally slow down as output stage current demands increase, the nfb loop then causes their internal impedance, and the delay caused by that impedance, as seen by the load, to become momentarily increased.
The X-Y method shows the error due to resistor load wrt loudspeaker, plus error due to loudspeaker load wrt resistor. As the amplifier's internal impedance reacts differently to each load I am not so sure that there is any 'cancellation' of non-linearities. My thoughts are that the amplifier will actually look worse, but then there is at least an opportunity to deal with all errors resulting from passive and dynamic loading.
Ovality is due to amplifier impedance allowing the reactive load to drive its output terminal wrt amplified input voltage; if you simulate with 'ideal' amplifiers the result is a straight line.
You appear to concerned that I am using a suddenly starting signal.
Don't forget that audio waves start suddenly to the bandwidth limit of the system itself.
It is pointless to filter say a 1kHz signal before applying it to an amplifier so that it cannot suddenly start with a change equivalent to real-world sources !
Strike a triangle and it does not slowly build up its first cycle, there is a singularly rich harmonic leading edge, some of which is both inaudible and not picked up by microphones !
Currently CDs are circa 20kHz, DVD-A/SACD 40kHz+, so these should set our filtering bases.
Besides if you run the X-Y examinations for many cycles they do not change much beyond say the third cycle, so the fuzzying (time based amplifier-loudspeaker interface energy storage and release exchange) is not merely a leading edge problem. Also the back emfs from different composite loudspeaker elements all arise at different time periods after initial music energisation, which is why the early half cycles are so asymmetrical.
So many folks seem to think that I do not understand this suddenly starting aspect, but equally I think that those who express such comments are the very ones who wrongly test amplifiers with 'non-musical' waveforms.
By rigidly applying their theoretical pre-filtering they are denying themselves the opportunity to see and make their designs capable of coping with what really can happen as a result of sibilant and transient loudspeaker energisation.
Re your harmonic square wave test and cosine test illustrations - very interesting. So many designers once believed that nfb 'protected' their amplifiers, and that increased levels made for endless improvement - not so.
You say that the speaker load is not wanted because it makes it harder to observe amplifier linearities. But maybe it is actually the amplifier's nfb reaction to the phase shifted loudspeaker generated back emf that is the significant problem, and, not the Nth degree of nfb loop generated amplitude linearity. Tube amps can be as 'bad' as 1% in the thd stakes, yet still drive real world loudspeakers better than 0.001% solid staters - they do not react as badly.
Yes figure 'C' has the lowest amplitude error. The phase shifted loudspeaker current is causing the complementary output stage to reverse commutate through a portion of its fixed common bias before the nfb loop regains control, and thus the waveform appearing at the tweeter will have an entire new and non coherent waveform across its terminals. This cannot happen with class-A, but phase shift can still introduce transient induced offsets where the amplifier has insufficient bandwidth/speed.
'D' has much less damping, but the error shows little in the way of generating a separately identifiable product.
Cheers ............. Graham.
hi Graham,
What are your thoughts on this?
When I was exposed to fourier analysis, I realised that there exist no instantaneous changes in nature. BW limiting is not limiting only maximum bandwidth, but also maximum rate of change of the spectrum. Thats nature of filtering.
Perfect full amplitude 10khz sine signal appearing from silence is not realistic signal due to the first cycle. It would require huge bw. It never happens in reality either. When you strike a triangle, first there appears cosinusoidal increase of amplitudes of large number of harmonics, including the lowest one. Its like a preringing of digital filters. The signal develops for finite amount of time. Check it: http://www.pcabx.com/technical/reference/triangle.wav
I understand that you try to simulate 'attack' of a musical instrument, but I've found that suddenly starting sine is overloading the system's expected bw usage more than is realistic. It is not a problem normally in sims, as it is wrappable/extendable, but with reactive loads this isn't resolved right due to missing past history. It overloads the reactive load and produces ripples that aren't real. That imo only clutters the graphs and confuses.
I've found that I'm able to better analyze results when signal spectrum is better controlled. I've opted to use toneburst signals instead of more severe pulses or sudden sines. For eg. see this http://www.diyaudio.com/forums/showthread.php?postid=528152#post528152 as example of most severe toneburst.
But afterall, it doesn't matter what signal you use if you know what you're doing and looking for.
Have you checked the step response of Ariel load with your method? It does not settle in 100ms. IIR. That fuzzying is purely due to impulse energy from the first cycle imo. I can't extract any amp impact there.
Adding speakerload changes the game alot. Phase shift is huge, partly due to finite output impedance. That makes the X-Y ovals very large, hiding fine details. Size of the oval is depending most of all on the time shift. It could be impedance, delay, NFB induced error. When the oval is large, its resolution is low. The variations around the ideal line (oval) are exposed only when you can get the timeshift small.
For eg. in your virtual scope traces, it is not easy to compare them, because they are in different scales. Fig. A is so far apart from the rest, that it is impossible to say if it is actually better or worse than say C. Series inductor increases output impedance, but *tubes* have huge Z too, that can't be bad for the sound and imaging? I'd try to bring them to common scale, by adjusting reference amp's delay and impedance. If there are similar problems in all of them, they should appear in sorta fair comparison.
I thought you might want to compare DUT with ideal amp into the same load. If ideal amp's phase response is matched to that of DUT, then time shift induced errors are minimized, and Y-axis will show more detail about DUT issues.
Btw, have you tried connecting the load resistor instead of to ground to another signal generator? It is effectively controlled reactive load. You avoid that way resonances and oscillations of passive speakerload.
Shouldn't amp slow down happen equally with resistive load? I don't understand well how you relate variance of delay of amp with reactive loading; you said its impossible to observe with R load. How you measure that delay when current and voltage are shifted wrt time as normal part of reactance? When I tried, looking at zero crossing instants, then variance of prop delay was so unbelievable that I had to stop thinking that voltage on amp outputs is right thing to look at. In fact, I started to suspect that its even not right to use voltage as a feedback signal. I wonder even if perfect voltage source is the ideal amp to drive reactive speakers..Graham Maynard said:You wrote agreed first - not second. Amplifiers quite literally slow down as output stage current demands increase, the nfb loop then causes their internal impedance, and the delay caused by that impedance, as seen by the load, to become momentarily increased.
What are your thoughts on this?
Y-axis shows difference between outputs. That imo cancels errors that are common with both loadings, cancellation not necessarily complete. Thats what I meant. Reactance would cause the errors to manifest shifted in time, and exposed, but imo they are then mixed with speaker late reaction to new signal and that makes it difficult to tell what is exactly what, or when. Very drastic things stick out, like the crossover spikes, but fine details stay hidden.The X-Y method shows the error due to resistor load wrt loudspeaker, plus error due to loudspeaker load wrt resistor. As the amplifier's internal impedance reacts differently to each load I am not so sure that there is any 'cancellation' of non-linearities. My thoughts are that the amplifier will actually look worse, but then there is at least an opportunity to deal with all errors resulting from passive and dynamic loading.
Please don't take this as arguing, but just as clarification of my view.You appear to concerned that I am using a suddenly starting signal.
Don't forget that audio waves start suddenly to the bandwidth limit of the system itself.
It is pointless to filter say a 1kHz signal before applying it to an amplifier so that it cannot suddenly start with a change equivalent to real-world sources !
Strike a triangle and it does not slowly build up its first cycle, there is a singularly rich harmonic leading edge, some of which is both inaudible and not picked up by microphones !
When I was exposed to fourier analysis, I realised that there exist no instantaneous changes in nature. BW limiting is not limiting only maximum bandwidth, but also maximum rate of change of the spectrum. Thats nature of filtering.
Perfect full amplitude 10khz sine signal appearing from silence is not realistic signal due to the first cycle. It would require huge bw. It never happens in reality either. When you strike a triangle, first there appears cosinusoidal increase of amplitudes of large number of harmonics, including the lowest one. Its like a preringing of digital filters. The signal develops for finite amount of time. Check it: http://www.pcabx.com/technical/reference/triangle.wav
I understand that you try to simulate 'attack' of a musical instrument, but I've found that suddenly starting sine is overloading the system's expected bw usage more than is realistic. It is not a problem normally in sims, as it is wrappable/extendable, but with reactive loads this isn't resolved right due to missing past history. It overloads the reactive load and produces ripples that aren't real. That imo only clutters the graphs and confuses.
I've found that I'm able to better analyze results when signal spectrum is better controlled. I've opted to use toneburst signals instead of more severe pulses or sudden sines. For eg. see this http://www.diyaudio.com/forums/showthread.php?postid=528152#post528152 as example of most severe toneburst.
But afterall, it doesn't matter what signal you use if you know what you're doing and looking for.
Can you be sure only first few cycles are affected? That depends on the load reactance, signal, source impedance. Check the attach. Thats speakerload I use, energized from perfect amp, just static 1mOhm impedance added. What can we say about that perfect amp? Wildly different shapes, fuzzy, and rings for long time. If I'd see that on amp output, I'd not know - to worry or not. But this one is perfectly normal behaviour, there is no first cycle distortion there, no changing output impedance, no NFB.Besides if you run the X-Y examinations for many cycles they do not change much beyond say the third cycle, so the fuzzying (time based amplifier-loudspeaker interface energy storage and release exchange) is not merely a leading edge problem. Also the back emfs from different composite loudspeaker elements all arise at different time periods after initial music energisation, which is why the early half cycles are so asymmetrical.
Have you checked the step response of Ariel load with your method? It does not settle in 100ms. IIR. That fuzzying is purely due to impulse energy from the first cycle imo. I can't extract any amp impact there.
Yes, but isn't impulse or step response better method for testing such things? It seems easier to interpret. Or the harmonic synthesized squarewave, it has benefit of being spectrally clean and not overload the system.So many folks seem to think that I do not understand this suddenly starting aspect, but equally I think that those who express such comments are the very ones who wrongly test amplifiers with 'non-musical' waveforms.
By rigidly applying their theoretical pre-filtering they are denying themselves the opportunity to see and make their designs capable of coping with what really can happen as a result of sibilant and transient loudspeaker energisation.
When I said not wanted, I meant my initial post approach. There, maximal zooming effect occurs when phase shift is minimal and controllable. It shows magnified nonlinearity of amp with closed loop. Of course you may be right and we should focus on amp-load interaction instead of amp linearity, but my first post focused on amp nonlinearity only.You say that the speaker load is not wanted because it makes it harder to observe amplifier linearities. But maybe it is actually the amplifier's nfb reaction to the phase shifted loudspeaker generated back emf that is the significant problem, and, not the Nth degree of nfb loop generated amplitude linearity. Tube amps can be as 'bad' as 1% in the thd stakes, yet still drive real world loudspeakers better than 0.001% solid staters - they do not react as badly.
Adding speakerload changes the game alot. Phase shift is huge, partly due to finite output impedance. That makes the X-Y ovals very large, hiding fine details. Size of the oval is depending most of all on the time shift. It could be impedance, delay, NFB induced error. When the oval is large, its resolution is low. The variations around the ideal line (oval) are exposed only when you can get the timeshift small.
For eg. in your virtual scope traces, it is not easy to compare them, because they are in different scales. Fig. A is so far apart from the rest, that it is impossible to say if it is actually better or worse than say C. Series inductor increases output impedance, but *tubes* have huge Z too, that can't be bad for the sound and imaging? I'd try to bring them to common scale, by adjusting reference amp's delay and impedance. If there are similar problems in all of them, they should appear in sorta fair comparison.
I thought you might want to compare DUT with ideal amp into the same load. If ideal amp's phase response is matched to that of DUT, then time shift induced errors are minimized, and Y-axis will show more detail about DUT issues.
Btw, have you tried connecting the load resistor instead of to ground to another signal generator? It is effectively controlled reactive load. You avoid that way resonances and oscillations of passive speakerload.
Attachments
A spectrum analysis (both magnitude & phase) seems more accurate and simpler to interpret
I completely agree, I've been reading this stuff and a spectrum analusus of the distortion is all to easy to deciper. Some of these charts look like the burn graph for a rocket engine!!
Mark
Hi Wimms.
I am hurrying here so I hope I am not making any errors.
Yes amplifiers slow down with resistor loading too, but this tends occur when the rate of change in voltage/current output demand is least - around natural amplitude clipping.
I know you understand what is going on, but music driven moments, or for that matter specific sinewave frequencies, where loudspeaker impedance is purely resistive and either 0, 360, 720 degrees etc. are very rare, and thus effective X-Y cancellations would be too.
Regarding sudden starting at 10kHz.
I have NEVER stated that this is a realistic waveform ... acceleration during the first 90 degrees is much greater than required, but it can be used during simulation to observe aspects of amplifier operation, load induced instability etc. Its only a method of looking for problems that should not arise; sure, some folks use square-waves or a step response - which are equally unrealistic - but useful.
Amplifiers that do not cope with square waves do not sound good, similarly, any amplifier that can cope with a suddenly starting simulated sinewave is not going to be limited with audio. The JLH and my class-A are * not upset * by it, and we should not forget that our audio chains remain capable of passing transient amplitude level changes that are more extreme than maximum linear 20kHz sinewave.
Also as you say - adding a speaker load changes the game a lot.
Actually doing this modifies amplifier output so much that you can hear it on headphones in another room. Different LS different sound! Thus I would love to see you making loudspeaker load (or RCL equivalent) investigations with your distortion microscope, and especially with your cosinusoidal input increase.
Your post#9 circuit illustration proves that loudspeaker back emf 'reflects' at the zero impedance of a perfect amplifier. The more nfb any amplifier has, the lower the output impedance, the more the ringing and the greater the potential for a modifying effect upon loudspeaker terminal waveform any series amplifier/cable impedance will have.
Like you I wonder if a perfect voltage source is the ideal way to drive reactive loudspeakers !?! I often add a question mark when discussing this.
JLH's solution was a good amplifier with a 220 milliohm resistor in series with the output terminal. The resistor reduced loudspeaker circuit ringing and reduced loudspeaker/amplifier interface distortion because it was in series with the amplifier's much lower nfb loop generated output impedance.
The different voltage scales on my illustrations show how badly a 6uH series output choke at the output of a high nfb amplifier in 'A', allows the loudspeaker to modify its own loudspeaker terminal voltage. Driver motor current flow is similarly affected, and bass/mid driver/crossover circuit back emf can affect tweeter terminal voltage.
This is separate from the loudspeaker generated crossover spikes illustrated in 'B' and 'C', also the waveform distortion due to a choke is insignificant if checked using a resistor load alone !
The error shown in 'C' is still there on 'A' but is choke masked and would need axis expansion to illustrate it.
Tube amps have higher series output R, and much less feedback (if used), so loudspeaker driven interaction with internal amplifier impedance is much less, as also is amplifier-loudspeaker resonance damping.
Yes I now always simulate by reverse driving an amplifier via its load resistance. There is an excellent correlation between this, the X-Y testing, probably your distortion microscope too, and, fundamental nulling with a virtual reactive load, though accurate nulling with the latter is much less easy to finalise.
Anyone who measures thd with a plain resistor misses out on the opportunity to visualise so many other waveform induced amplifier problems.
Hi AudioWizard.
Yes spectrum analysis can reveal the overall outcome of distortion products, but unlike observations discussed above you cannot similarly tie down the waveform related instant of distortion causation in order to deal with it.
Equally spectrum analysis is not going to be useful if you do not use a representative loudspeaker load because nfb loop induced current flows are quite different and induce quite different internal amplifier responses to when the load is a 'dummy' resistor !
Hi Nelson and Mark,
But would you ignore the results, especially when headphone monitoring of amplifier output confirms the effects being illustrated.
Of course our ears must be the final arbiters !
Cheers ............. Graham.
hi Graham,
I tried nulling the output of amp to input with speakerload. It is quite daunting and confusing, especially with toneburst. At the precision level I wanted, even minute FR phase nonlinearities translate into notable amplitude errors that aren't caused by amp. I had to measure precise output impedance, amp lag and its gain into testload, and copy that all to ideal amp. That works for single amplitude, frequency, lag. I couldn't get it perfect, but I think the null is at reasonable level.
As I suspected, changes due to reactive load are such that it is quite unhelpful to graph them as ovals. So instead I found that linear-time graph is better in this case.
See attach. There you can see simultaneous graphs of output voltage, amp output current I(Rout), and error voltages for 180W peak load. Input signal is 3 periods of toneburst at 10Khz (10Khz AM-modulated by 10Khz) starting from 100us. Speakerload is 3way speaker model instead of Ariel. Tested amp is what I posted in your AABB thread - JLH topology. Its measured Zout is 2m ohms.
V(out-inp) is amp output loaded with speaker minus output of delayed linear amp into no load.
V(ref-out) is delayed ideal amp loaded with speaker minus output of tested amp with exact same speakerload.
V(ref-res) is delayed ideal amp loaded with speaker minus output of delayed ideal amp loaded with resistive impedance of speaker.
I'm not sure if exact shapes mean anything, but this is what I see from such measurements.
V(ref-res) serves as reference - linear amp loaded with speaker. It shows expected voltage errors due to reactive loading on finite output impedance.
Out-inp graph should match ref-res. Deviations there are due to nonlinearities, lag variance and Zout changes.
We can see that error voltage varies around reference, trying to track voltage, NFB at work. Initial excess negative error is likely result of forward prop delay, openloop gain generated, until NFB catches up. V(ref-out) shows difference between expected voltage on reactive load and real amp - supposedly exposing all amp nonlinearities arising due to reactive loading. Positive ref-out error voltage means amp output lags behind reference, though it also includes all amp nonlinearities. Difference is mainly lag (mostly positive error). Negative error dropouts on ref-out line seems to be due to back-emf.
Compared to ref-res, ideal amp with same load, we can see that output of real amp sort of lags ideal ref-res line.
Interesting event occurs near 60us. Seems like due to initial lag amp is compensating to reduce error, but due to backemf is flipping over to other extreme, overdoing, and is stuck tracking delayed NFB, being chronically late. I think this is where we can see error generated due to NFB lag.
I'd like to note that output current needs to lead the voltage. Initial current transient is very close to voltage in time, but as the waveform develops, the timing difference between current and voltage increases. This suggests that load is capacitive dominantly, and to develop voltage NFB expects and targets, current must ideally lead input transient at least for amount of amp lag. In other words, I'm having impression that for voltage NFB to work right, it must start compensating before input signal arrives. As this is impossible, at all transients error voltage is developed, and the "catching up" rush begins. That rush causes several problems by trying to correct voltage error that may have been safely ignored. For one, apart from nonlinearities of amp, I think this is causing phase modulation on leading edges of transients.
I'd compare this to jitter. In fact, while trying to achieve null, I've found that it is nearly impossible to distinguish errors arising from nonlinearities vs timing, and basically all nonlinearities could be reduced to signal correlated jitter. Remembering that incredibly low amounts of jitter is audible, that makes you wonder.
I'm getting general impression that voltage NFB should be taken before output stage where minimal reactance is, and output stage should be unity buffer outside global NFB. I can't see how NFB would otherwise work flawlessly. And by looking at different output impedances, I don't see that as very important thing byitself. I'm thinking that if output stage buffer has series feedback with the load, that is pretty much sufficient for damping.
Do you agree with my reasoning?
I tried nulling the output of amp to input with speakerload. It is quite daunting and confusing, especially with toneburst. At the precision level I wanted, even minute FR phase nonlinearities translate into notable amplitude errors that aren't caused by amp. I had to measure precise output impedance, amp lag and its gain into testload, and copy that all to ideal amp. That works for single amplitude, frequency, lag. I couldn't get it perfect, but I think the null is at reasonable level.
As I suspected, changes due to reactive load are such that it is quite unhelpful to graph them as ovals. So instead I found that linear-time graph is better in this case.
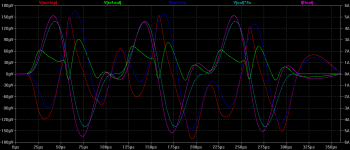
See attach. There you can see simultaneous graphs of output voltage, amp output current I(Rout), and error voltages for 180W peak load. Input signal is 3 periods of toneburst at 10Khz (10Khz AM-modulated by 10Khz) starting from 100us. Speakerload is 3way speaker model instead of Ariel. Tested amp is what I posted in your AABB thread - JLH topology. Its measured Zout is 2m ohms.
V(out-inp) is amp output loaded with speaker minus output of delayed linear amp into no load.
V(ref-out) is delayed ideal amp loaded with speaker minus output of tested amp with exact same speakerload.
V(ref-res) is delayed ideal amp loaded with speaker minus output of delayed ideal amp loaded with resistive impedance of speaker.
I'm not sure if exact shapes mean anything, but this is what I see from such measurements.
V(ref-res) serves as reference - linear amp loaded with speaker. It shows expected voltage errors due to reactive loading on finite output impedance.
Out-inp graph should match ref-res. Deviations there are due to nonlinearities, lag variance and Zout changes.
We can see that error voltage varies around reference, trying to track voltage, NFB at work. Initial excess negative error is likely result of forward prop delay, openloop gain generated, until NFB catches up. V(ref-out) shows difference between expected voltage on reactive load and real amp - supposedly exposing all amp nonlinearities arising due to reactive loading. Positive ref-out error voltage means amp output lags behind reference, though it also includes all amp nonlinearities. Difference is mainly lag (mostly positive error). Negative error dropouts on ref-out line seems to be due to back-emf.
Compared to ref-res, ideal amp with same load, we can see that output of real amp sort of lags ideal ref-res line.
Interesting event occurs near 60us. Seems like due to initial lag amp is compensating to reduce error, but due to backemf is flipping over to other extreme, overdoing, and is stuck tracking delayed NFB, being chronically late. I think this is where we can see error generated due to NFB lag.
I'd like to note that output current needs to lead the voltage. Initial current transient is very close to voltage in time, but as the waveform develops, the timing difference between current and voltage increases. This suggests that load is capacitive dominantly, and to develop voltage NFB expects and targets, current must ideally lead input transient at least for amount of amp lag. In other words, I'm having impression that for voltage NFB to work right, it must start compensating before input signal arrives. As this is impossible, at all transients error voltage is developed, and the "catching up" rush begins. That rush causes several problems by trying to correct voltage error that may have been safely ignored. For one, apart from nonlinearities of amp, I think this is causing phase modulation on leading edges of transients.
I'd compare this to jitter. In fact, while trying to achieve null, I've found that it is nearly impossible to distinguish errors arising from nonlinearities vs timing, and basically all nonlinearities could be reduced to signal correlated jitter. Remembering that incredibly low amounts of jitter is audible, that makes you wonder.
I'm getting general impression that voltage NFB should be taken before output stage where minimal reactance is, and output stage should be unity buffer outside global NFB. I can't see how NFB would otherwise work flawlessly. And by looking at different output impedances, I don't see that as very important thing byitself. I'm thinking that if output stage buffer has series feedback with the load, that is pretty much sufficient for damping.
Do you agree with my reasoning?
Attachments
Hi Wimms,
My - my, this takes some thinking about, hence the delay.
Before I go further. I choose to stick with the virtual 'Ariel' because it is a challengingly awkward load for amplifier testing.
When a crossover circuit has plain 6dB, or greater than 12dB per octave networks I have noted that it becomes much easier for an amplifier to drive, but then sound waveform recomposition via driver motor output could become much more difficult to optimise.
Another point. You are here displaying an amplifier circuit that cannot exhibit back-emf driven fractional bias voltage reverse commution as do the majority of conventional class-AB 'hi-fi' amplifiers ! Thus the waveforms here will be quite unlike and possibly less discontinuous that with other 'hi-fi' amplifier designs.
I agree that linear time display is very useful, but I would like to be able to see either the input voltage or the voltage at the output of the unloaded ideal amplifier divided by an appropriate factor (say 100 ~ 1000) to give a visual reference for zero level waveform voltage crossovers.
Without an original voltage waveform reference I am struggling to interpret what is happening.
At 60uS has the load induced output terminal current already reversed before the waveform voltage has passed through zero, and thus the nfb loop sensed current correction is no longer in phase with normal input voltage driving current ? This is where amplifier propagation delay generates entirely new parasitic waveforms that 'shimmy' or in the case of class-AB 'zig-zag' about normal. I would agree that it is similar to jitter, though I prefer to leave that term to its more logical meaning within CD technology, though both problems are related to differential image focussing accuracy and reproduction clarity.
Voltage nfb taken before the output stage will remove nfb loop induced interaction but still not be ideal either, especially with any output stage that is not perfect class-A. Series impedance will still allow output terminal voltage shift (wrt original waveform) to be generated by loudspeaker induced back emf such that a crossover or one driver back emf can still affect another driver, say modifying tweeter harmonics.
JLH chose to produce a good class-AB output and then use a 220 milliohm resistor between amp and loudspeaker, this would protect each from the worst reactive effects induced by the other.
The other approach is of course to construct an amplifier that is so fast (very low propagation delay) and powerful (high current capability without device protection) as to produce a perfectly amplified voltage no matter what loudspeaker loading effects might subsequently arise.
But as to which any design will sound best still cannot be determined theoretically, only empirically. Maybe Susan already has hit the mark with her 'no global feedback' circuits.
Cheers ............. Graham.
Graham, I'm in a hurry, so just to clarify a little.
I chose another speakermodel instead of Ariel because I've found it to be more difficult load in sims. I'll post its circuit later. I realise that I should have used Ariel for more common ground, but I didn't want to repeat all the nulling again. I'll look into that later.
I played with this JLH/AABB combo just to look if and how does reactive load impact class-A amps as well. I realize that in AB amps it would have been worse.
Re input voltage reference. It is there as out*4u. This amp follows input so well that graphing input voltage separately isn't showing any visible differences. The error voltages are -100db below output levels. The voltage lag between input and output is around 10ns. This isn't visible. So you can safely assume that V(out) is the input waveform.
btw, I made an error in previous post, the wave starts at 10us not 100us.
I'm not sure if perfect voltage source no matter what loading is actually right goal to pursue. More on that later.
Hi Wimms.
My method for an initial setting up the fundamental null.
Run say three full cycles. Measure the plus and minus peak amplitudes for the second cycle and use their average for the null source amplitude.
Expand the horizontal axis for the end of second cycle zero crossover, and measure the microseconds of delay; eg. 1uS.
Using this figure as a percentage of the cyclic time period calculate the angle of delay wrt 360 degrees; eg. 3.6 degrees @10kHz.
Subtract this figure from 360 degrees, and use the result as the starting angle for the nulling source; eg. 356.4 degrees.
This can speed things up a bit.
__________________________________________
I am still at a loss to understand your traces in post#14.
I would normally show the input or output terminal voltage scaled down so that an energising voltage reference is clear. If I saw an outline sketch of the test arrangement showing the meter positions it might help.
I also found that because any amplifier is differently influenced by its load/signal, a fundamental null must be separately established for each specific amplifier/load/sinusoid.
Take the green trace.
This looks like the sort of trace I have had, though here there may be a need to adjust the amplitude by about 50uV.
While the distortion amplitude is low it reveals output stage imbalance which I have concluded as being a cause of audible distortion when you get any JLH class-A like circuit going in real life and momentarily overloaded by music waveforms.
The green trace shows an error relating to inherent inability for the positive pulling output device to fully match nfb loop control output slew due to its limited pure current positive drive and the lack of a proper turn off for the lower device; ie. no pull-down.
Moving on to 60uS, the negative swing becomes accurately nfb loop control driven through a negative slew because the negative pulling device has its current drive via the phase splitter emitter while the phase splitter collector simultaneously pulls down the positive pulling output device. Charge storage within the upper device provides an additional source of current for the phase splitter to energise the lower output device.
Cheers ............. Graham.
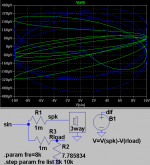
Hi Graham,
See attached a sketch of my test setup. It took me long to figure out how to let the spice do most of the nulling. I'm running this setup several times to approach null. First simple run, and observe the Zout and Gain in meas results. These are amp specs into given load. Copy these into params, rerun the test. Observe newgain2, if it differs from gain2, put new value into gain2. Observe Lag_error. It should be kept towards zero. Add the difference to lag of wlet2 input. Rerun the sim. I'm done when Zout, Gain2 doesn't change, and lag_error is below picosec.
I don't see purpose for pulldown resistors in driving 100% class-a stage. The current never reverses from bases, thus pulldown never occurs. It simply loads the splitter. CCS seems more fit for that.
At 60us, I'm not sure the nfb loop has any control there. The lower device pulling is to a degree canceled by upper device excess base charge induced current. The sudden drop of error signal is imho simply because of inductive reactance kicking its backemf.
I'm wondering that backemf can't help consuming base charge of lower device, and they stay excessively conducting for longer than upper device, giving impression that its the upper devices that are slow pulling up.
See attached a sketch of my test setup. It took me long to figure out how to let the spice do most of the nulling. I'm running this setup several times to approach null. First simple run, and observe the Zout and Gain in meas results. These are amp specs into given load. Copy these into params, rerun the test. Observe newgain2, if it differs from gain2, put new value into gain2. Observe Lag_error. It should be kept towards zero. Add the difference to lag of wlet2 input. Rerun the sim. I'm done when Zout, Gain2 doesn't change, and lag_error is below picosec.
I find that the trouble is not in the output stage, but the splitter. Especially without pulldown resistor. In that case all driver current simply must split perfectly. Trouble comes from splitter base current, and from gm changes of splitter with voltage swing.The green trace shows an error relating to inherent inability for the positive pulling output device to fully match nfb loop control output slew due to its limited pure current positive drive and the lack of a proper turn off for the lower device; ie. no pull-down.
I don't see purpose for pulldown resistors in driving 100% class-a stage. The current never reverses from bases, thus pulldown never occurs. It simply loads the splitter. CCS seems more fit for that.
But, upper CCS is never exhausted, there is always enough current for positive device, like there is no other current source for lower device. For upper device to provide its base storage, there must occur base current reversal. How can that happen if bootstrap isn't exhausted? That would cause output switching. I don't think upper device base charge is contributing any splitter current. It only causes lag in current modulation of output devices, and upper device base charge is sucked out through crossconducance or load.Moving on to 60uS, the negative swing becomes accurately nfb loop control driven through a negative slew because the negative pulling device has its current drive via the phase splitter emitter while the phase splitter collector simultaneously pulls down the positive pulling output device. Charge storage within the upper device provides an additional source of current for the phase splitter to energise the lower output device.
At 60us, I'm not sure the nfb loop has any control there. The lower device pulling is to a degree canceled by upper device excess base charge induced current. The sudden drop of error signal is imho simply because of inductive reactance kicking its backemf.
I'm wondering that backemf can't help consuming base charge of lower device, and they stay excessively conducting for longer than upper device, giving impression that its the upper devices that are slow pulling up.
Attachments
Nelson Pass said:I'm going to suggest that simulations will not accurately
predict distortion level at -100 db levels. I would not
even trust them at 1% (-40 dB).
Nelson, I simply suggest that you are wrong based on my experience with our internal simulators. That which is available to the masses just does not match up with the state of the art.
- Status
- This old topic is closed. If you want to reopen this topic, contact a moderator using the "Report Post" button.
- Home
- Amplifiers
- Solid State
- Distortion microscope?